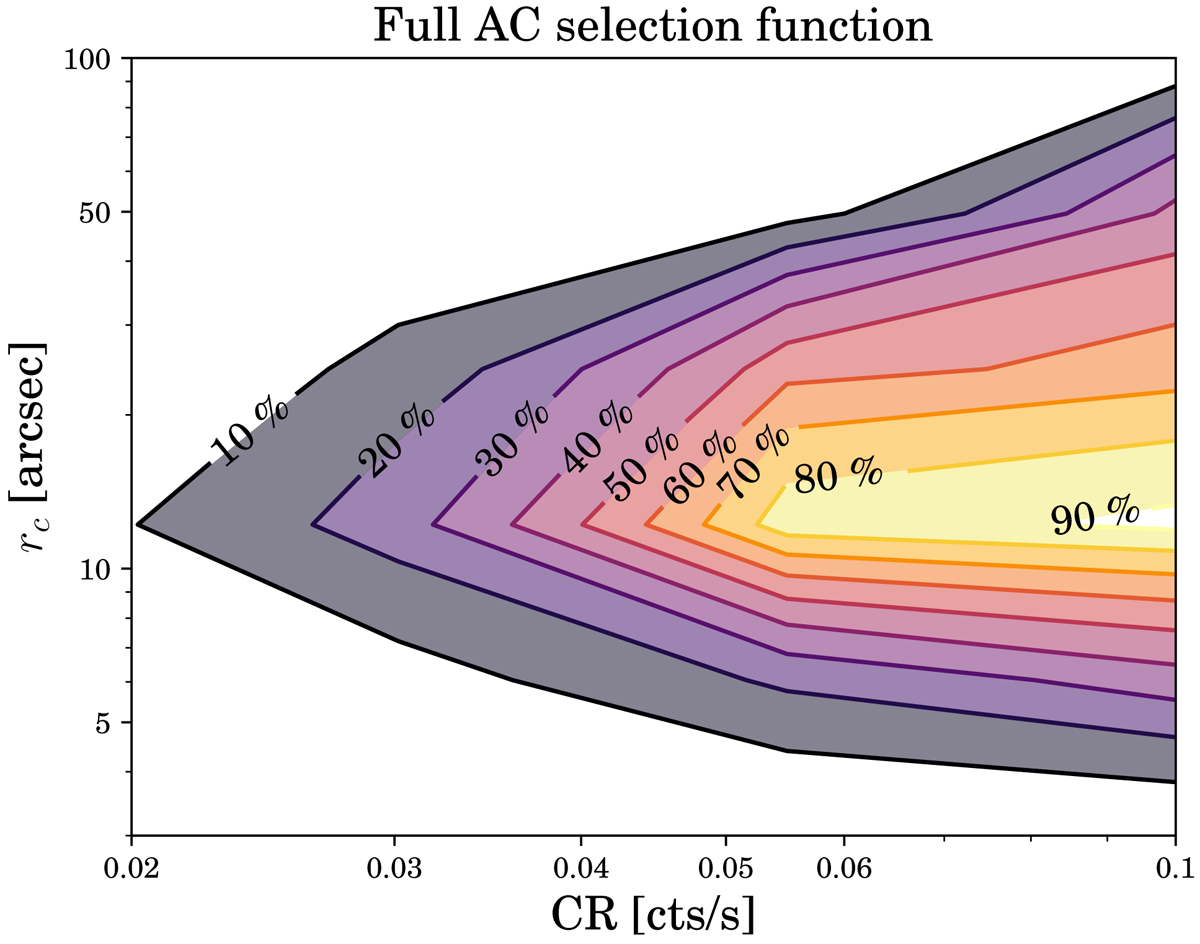
Fig. 4.
Download original image
Contours of AC detection probability as a function of the total count rate (CR) in the 0.5–2 keV band and the input core radius (rc) from the β model. An exposure time of 10 ks was used along with nominal background value of b = 1. The flux ratio chosen was 0.5, i.e. half the count rate of the cluster is contained within the central AGN.
Current usage metrics show cumulative count of Article Views (full-text article views including HTML views, PDF and ePub downloads, according to the available data) and Abstracts Views on Vision4Press platform.
Data correspond to usage on the plateform after 2015. The current usage metrics is available 48-96 hours after online publication and is updated daily on week days.
Initial download of the metrics may take a while.