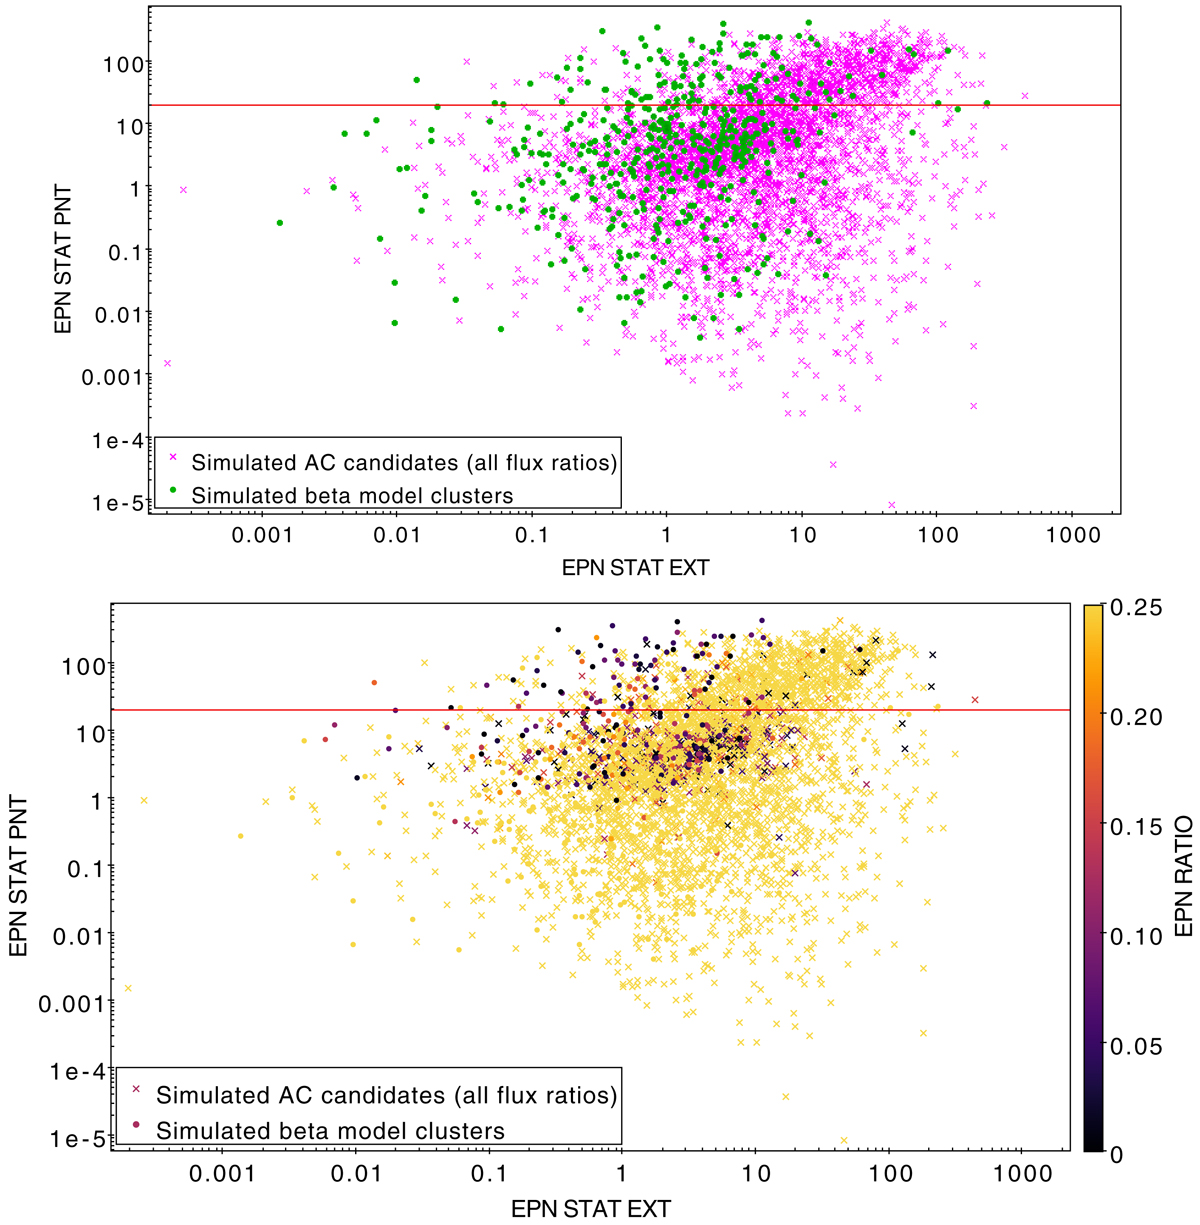
Fig. 3.
Download original image
Population of simulated AC and uncontaminated clusters in the output XAMIN parameter space. Top panel: distribution of AC sources (pink crosses) compared with uncontaminated clusters (green circles). Bottom panel: distribution of AC sources and uncontaminated clusters shaded according to the EPN_RATIO parameter. The red line highlights the EPN_STAT_PNT > 20 cut. Dark shaded circles above the red line indicate pure clusters that are separable from the AC population due to their having an EPN_RATIO ≤ 0.2.
Current usage metrics show cumulative count of Article Views (full-text article views including HTML views, PDF and ePub downloads, according to the available data) and Abstracts Views on Vision4Press platform.
Data correspond to usage on the plateform after 2015. The current usage metrics is available 48-96 hours after online publication and is updated daily on week days.
Initial download of the metrics may take a while.