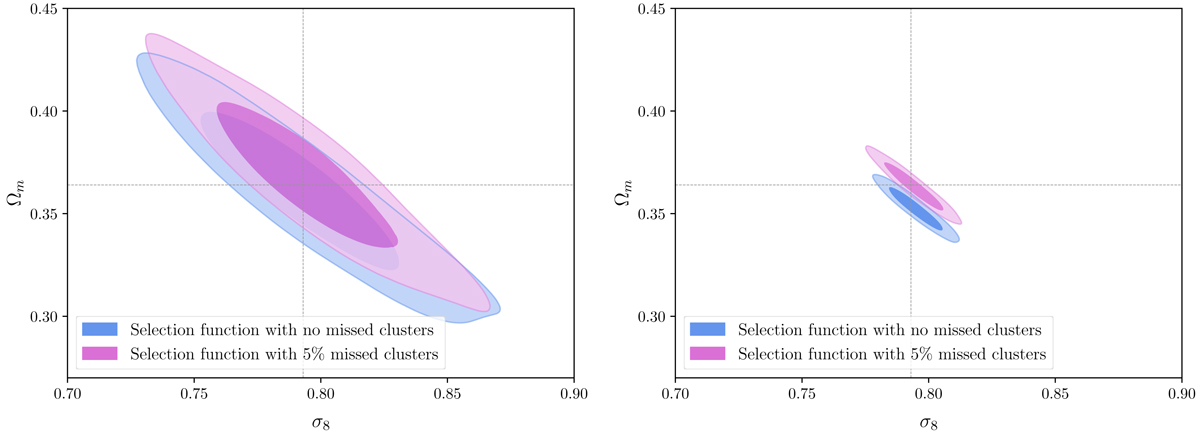
Fig. 11.

Download original image
Bias introduced in Ωm − σ8 plane without accounting for missed clusters in the cluster selection function. All other parameters, including scaling relation coefficients, are fixed. The pink contours show the recovered constraints from a complete selection function, while the blue contours reflect the results obtained by fitting the cosmological parameters assuming only pure, extended sources. The contours represent the 68% and 95% confidence intervals respectively. The dashed lines indicate the fiducial input values used for the mock number density of clusters (see XXL Paper XLVI for further details). The left panel shows the results for an XXL-like survey area and the right one shows results for a survey of 1000 deg2.
Current usage metrics show cumulative count of Article Views (full-text article views including HTML views, PDF and ePub downloads, according to the available data) and Abstracts Views on Vision4Press platform.
Data correspond to usage on the plateform after 2015. The current usage metrics is available 48-96 hours after online publication and is updated daily on week days.
Initial download of the metrics may take a while.


