Fig. 1.

Download original image
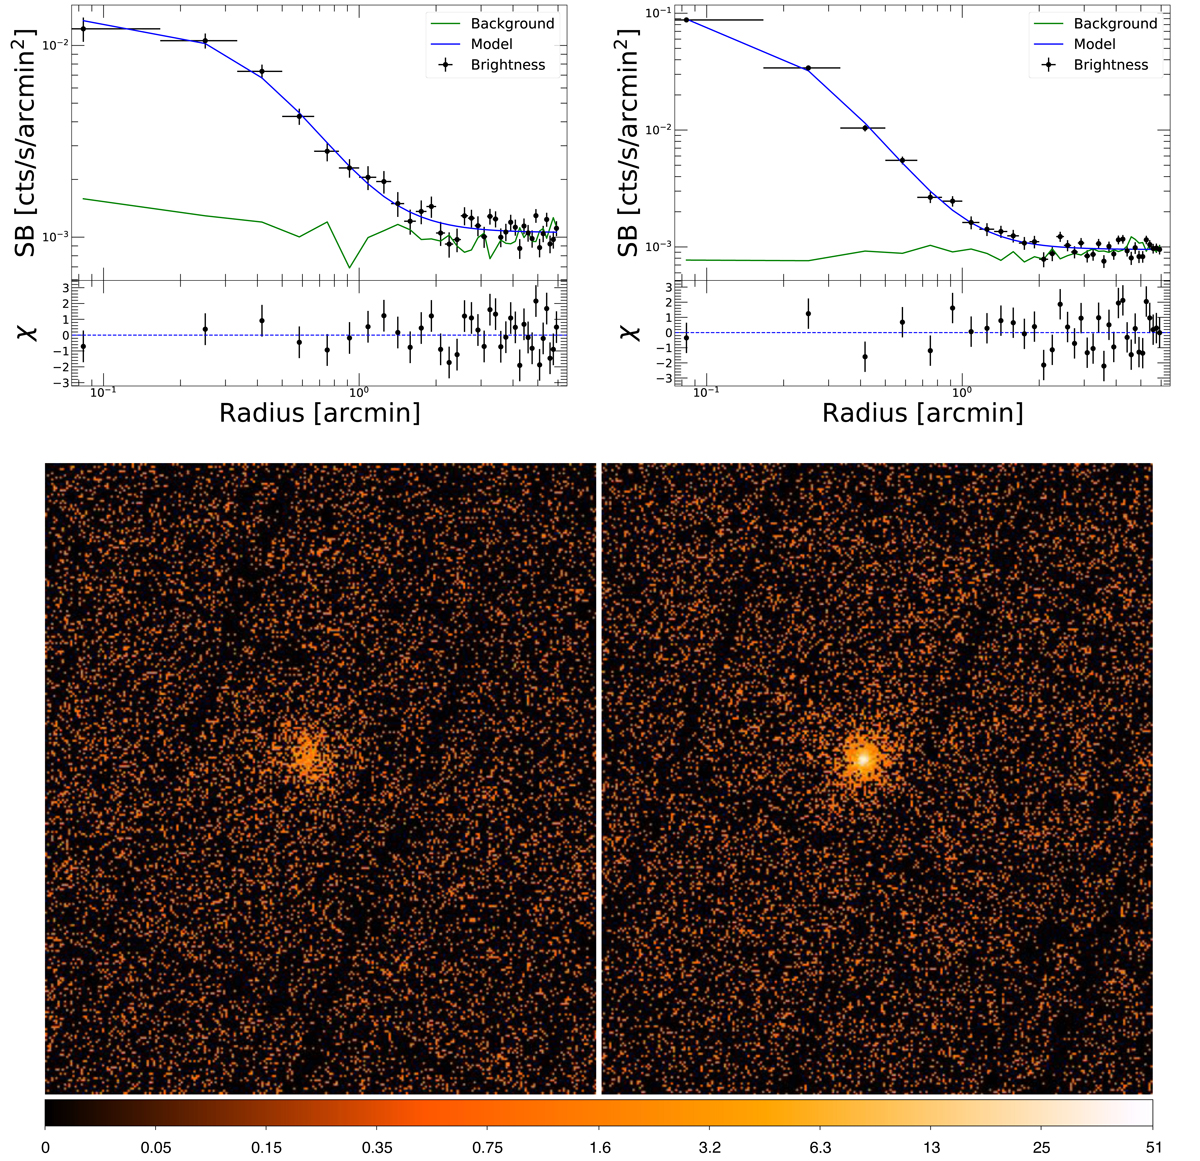
Comparison of simulated uncontaminated (left) and point-source contaminated (right) clusters. Top panel: surface brightness (SB) distribution showing the extracted cluster profiles (black crosses) are plotted against the blue line corresponding to the fitted β-model; the green line displays the particle background level extracted from each image. Bottom panel: simulated 10 ks XMM pointings showing a cluster with a core radius rc = 20″ and count rate CR = 0.1 cts s−1. For the contaminated cluster, 50% of the overall source counts lie within the central point source. The colour bar shows the number of photons within each pixel (2.5″ per pixel scale).
Current usage metrics show cumulative count of Article Views (full-text article views including HTML views, PDF and ePub downloads, according to the available data) and Abstracts Views on Vision4Press platform.
Data correspond to usage on the plateform after 2015. The current usage metrics is available 48-96 hours after online publication and is updated daily on week days.
Initial download of the metrics may take a while.


