Fig. 23.
Download original image
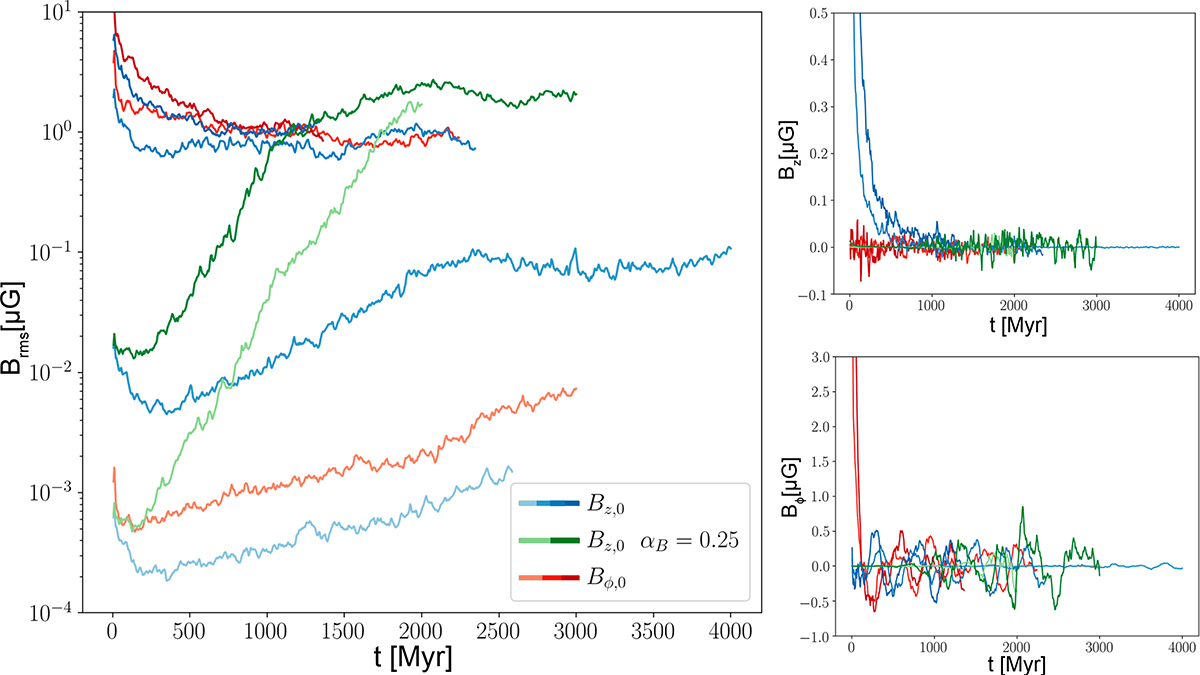
Time evolution of Brms (left panel) and the vertical and toroidal fluxes (right panel) within the central disk for different initial field strengths and geometry. Darker lines represent a lower initial thermal plasma beta βth within the center of the disk. The distinct levels of initial central plasma beta are (β0, center = (107, 104, 1, 0.1)). We can see that for the low plasma beta cases (β0, center ≤ 1) the magnetic field strength is quickly reduced at the beginning of the simulation, but eventually saturates at a level around 1 μG. This is a similar saturation level as the αB = 0.25 simulations that grow from much weaker initial fields at the same resolution. Due to this outflow of magnetic flux, we can see that all simulations reduce to a similar oscillating flux within the central disk for the vertical and toroidal fields.
Current usage metrics show cumulative count of Article Views (full-text article views including HTML views, PDF and ePub downloads, according to the available data) and Abstracts Views on Vision4Press platform.
Data correspond to usage on the plateform after 2015. The current usage metrics is available 48-96 hours after online publication and is updated daily on week days.
Initial download of the metrics may take a while.