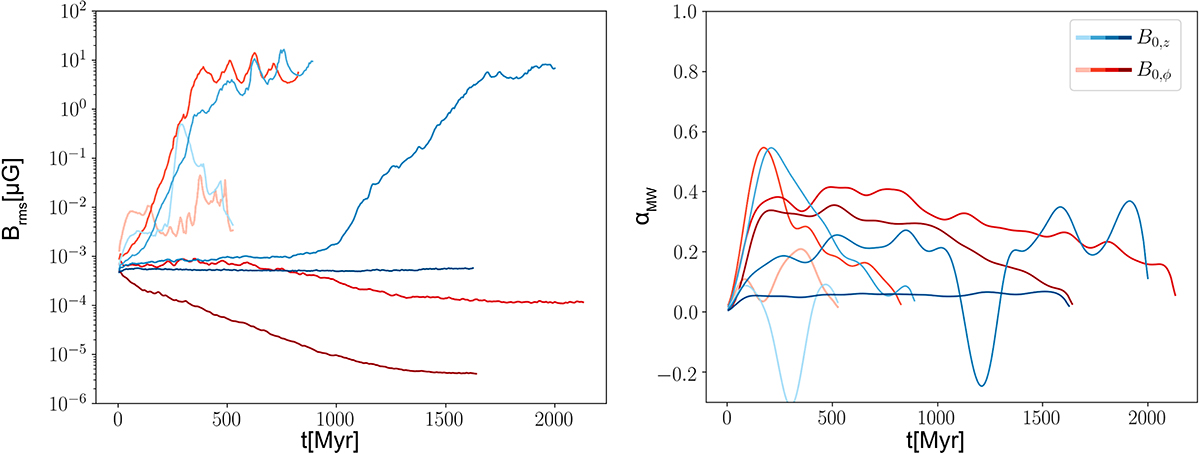
Fig. 2.
Download original image
Time evolution of the average magnetic field strength (left panel) and the normalized Maxwell stress (right panel) for the no feedback runs. Blue lines represent simulations with an initial vertical field and the red lines represent simulations with an initial toroidal field. Darker colors represent higher Jeans floor (NJ = (4, 8, 10, 16)). The NJ = 4 and NJ = 8 simulations have a rapid amplification in the magnetic field early on due to spiral arm compression. We can see that we get the strongest αMW exhibited during the growth phase of the NJ = 8 cases, correlating to the generation of radial and toroidal fields during the dynamo process. The elevated level in αMW for all the cases with an initial toroidal field is simply due to the initial field and normalization (Bz ≈ 0).
Current usage metrics show cumulative count of Article Views (full-text article views including HTML views, PDF and ePub downloads, according to the available data) and Abstracts Views on Vision4Press platform.
Data correspond to usage on the plateform after 2015. The current usage metrics is available 48-96 hours after online publication and is updated daily on week days.
Initial download of the metrics may take a while.