Fig. 17.
Download original image
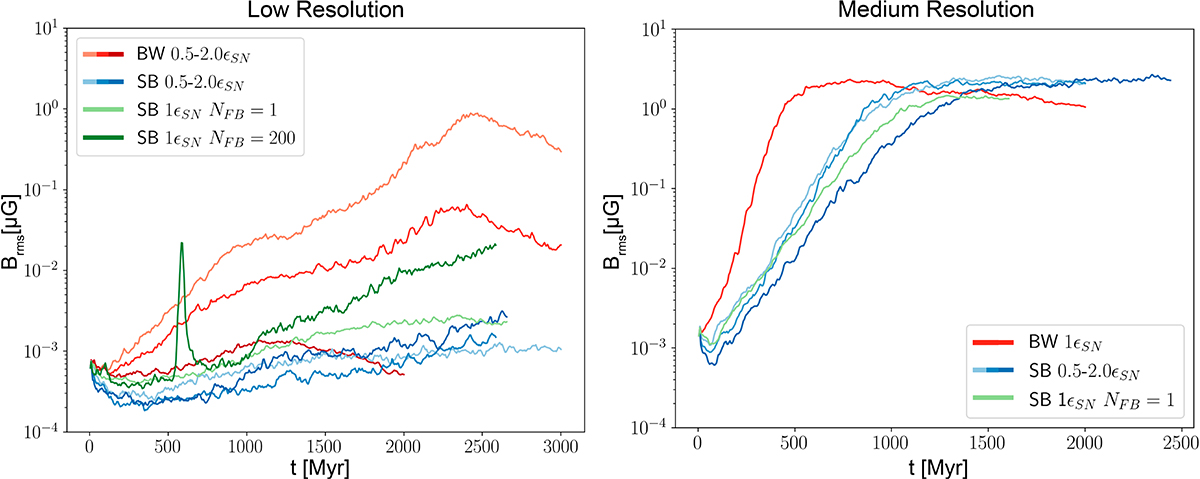
Time evolution of Brms within the central disk for different feedback schemes. Left panel show the Low resolution runs and right panel show the Medium resolution runs. Darker colors in blue and red indicate stronger feedback strength and light green represent the physical SB model (NFB = 1) and dark green represent SB model with higher coupling (NFB = 200). Its clear from both resolutions that the blastwave scheme produce faster amplification than the superbubble schemes. Higher energy injection does in general lead to slower growth of the magnetic field within the central disk. Increasing the coupling/injection length of the superbubble scheme does seem to generally have a positive effect on the magnetic field amplification. The bump seen in the NFB = 200 evolution is due to rapid amplification of the magnetic field during the merger of two fragments within the central region, which afterwards is quickly dispersed outward from the central disk.
Current usage metrics show cumulative count of Article Views (full-text article views including HTML views, PDF and ePub downloads, according to the available data) and Abstracts Views on Vision4Press platform.
Data correspond to usage on the plateform after 2015. The current usage metrics is available 48-96 hours after online publication and is updated daily on week days.
Initial download of the metrics may take a while.