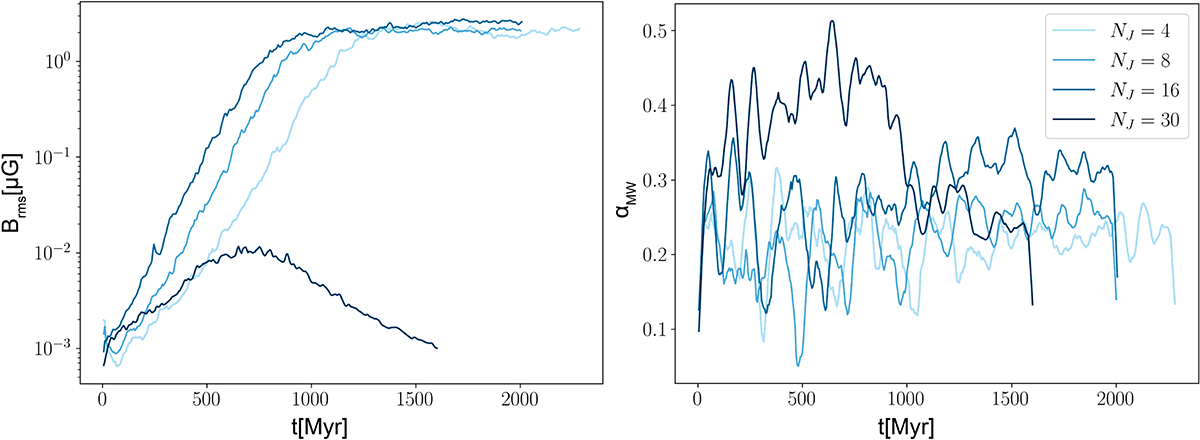
Fig. 14.
Download original image
Time plots for the medium resolution feedback runs with varying Jeans floor. The left and right panel shows the evolution of Brms and αMW respectively. Darker colors represents higher Jeans floor. We can see that there is a positive dependence on the Jeans floor for the amplification rate, as long as a “critical” collapse length is resolved. The normalized Maxwell stress lie around αMW = 0.1 − 0.3 for all runs. There is additional stress within the NJ = 30 simulation during the early amplification phase with around αMW = 0.4.
Current usage metrics show cumulative count of Article Views (full-text article views including HTML views, PDF and ePub downloads, according to the available data) and Abstracts Views on Vision4Press platform.
Data correspond to usage on the plateform after 2015. The current usage metrics is available 48-96 hours after online publication and is updated daily on week days.
Initial download of the metrics may take a while.