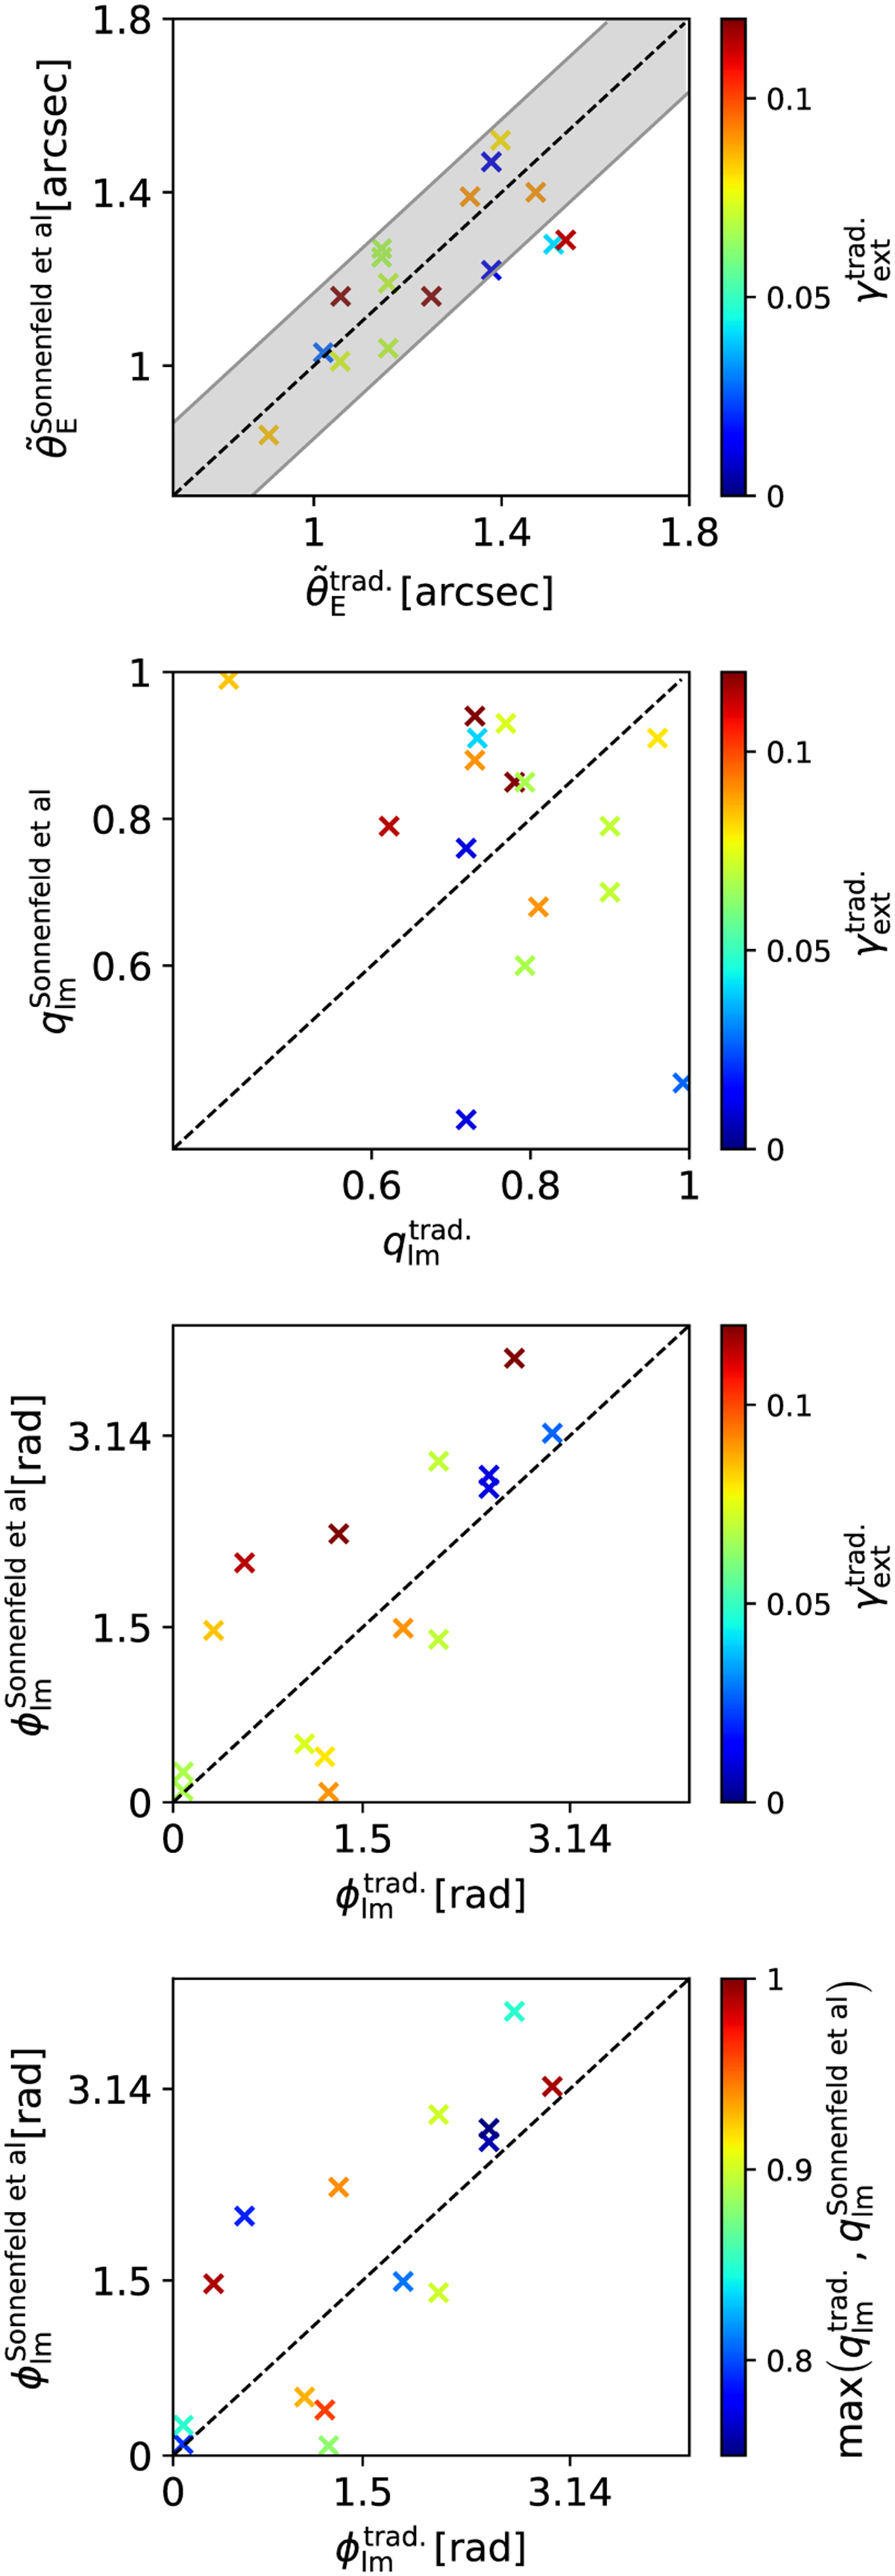
Fig. 3
Download original image
Comparison of the SIE parameter values obtained with GLEE & GLAD using SIE+γext to those values from Sonnenfeld et al. (2013, 2019) adopting mainly SIE-only. The gray shaded region in the first panel indicates the 1 pixel range. The discrepancy is mostly due to the difference in the adopted mass model in this work and in Sonnenfeld et al. (2013, 2019).
Current usage metrics show cumulative count of Article Views (full-text article views including HTML views, PDF and ePub downloads, according to the available data) and Abstracts Views on Vision4Press platform.
Data correspond to usage on the plateform after 2015. The current usage metrics is available 48-96 hours after online publication and is updated daily on week days.
Initial download of the metrics may take a while.