Fig. 5
Download original image
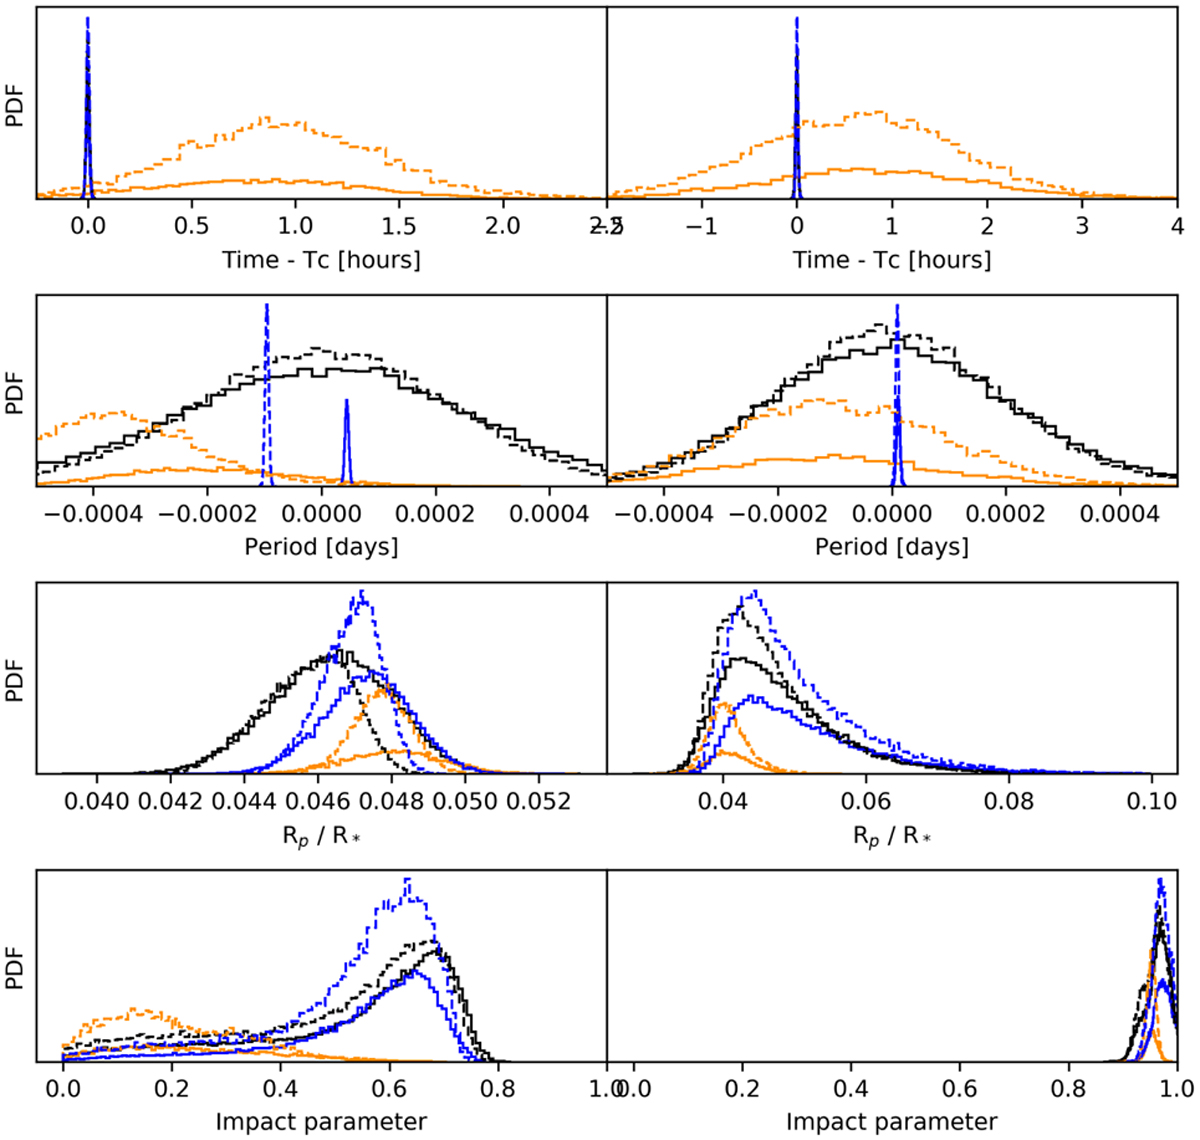
Posterior distributions for the Bayesian inference with the joint GP-transit model (plain lines) and linear model (dashed lines) for the sector 4 light curve (black), for sector 31 with the 2-min cadence (orange), and on the combined 2-min cadence light-curve dataset (blue). From top to bottom: time of inferior conjunction, period, ratio of the planet to star radius and impact parameter for planet b (first column) and planet c (second column). Inference on sector 31 shows a broad distribution and a 1-h time transit variation and shift in the orbital period. This broad distribution seems to result from the higher amplitude of the polluting signal at 1.4 days for sector 31. The inference on the combined light curve dataset converges towards the same values as the inference on sector 4.
Current usage metrics show cumulative count of Article Views (full-text article views including HTML views, PDF and ePub downloads, according to the available data) and Abstracts Views on Vision4Press platform.
Data correspond to usage on the plateform after 2015. The current usage metrics is available 48-96 hours after online publication and is updated daily on week days.
Initial download of the metrics may take a while.