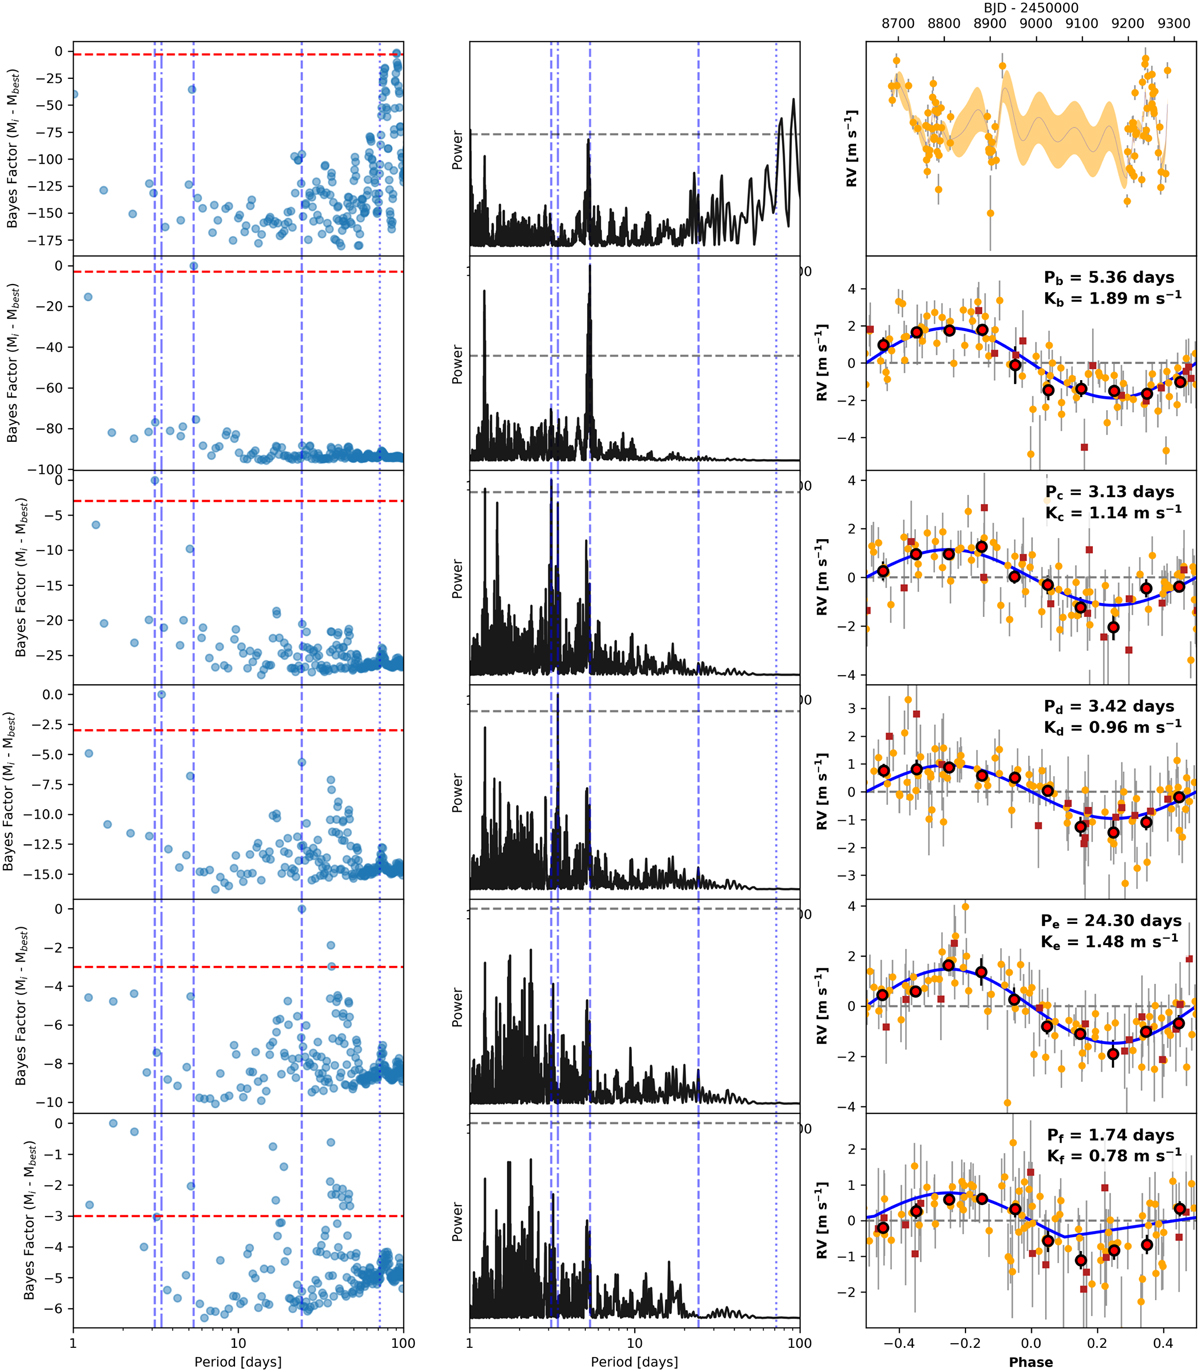
Fig. A.8
Download original image
Blind search for Keplerian signals in the radial velocity dataset. The period parameter space is subdivided into bins of 0.5 days. An iteration corresponds to a Bayesian inference for each bin with a Keplerian model (first row) or a joint GP-Keplerian model with one to five planets (rows 2 to 6). The first column shows the logarithm of the Bayes factor of each model/period bin with the best model/period bin of the iteration. The second column shows the Lomb-Scargle periodogram computed with the residue of the best model from the previous iteration (except for the first row, which is the periodogram from the data). The last column shows the best fit to the data from the best model/period of the iteration, except for the first row, which shows the GP fit to the ESPRESSO dataset. The dashed vertical lines for columns 1 and 2 indicate the three Keplerian signals at 5.4, 3.1, and 24.3 days, the dotted vertical line indicates the 72-day period associated with the stellar rotation, and the dotted-dashed vertical line indicates the polluting signal at 3.4 days. The horizontal dashed line in column 1 indicates the moderate threshold for the model selection. The horizontal dashed line in column 2 indicates the level for a false-alarm probability of 1%.
Current usage metrics show cumulative count of Article Views (full-text article views including HTML views, PDF and ePub downloads, according to the available data) and Abstracts Views on Vision4Press platform.
Data correspond to usage on the plateform after 2015. The current usage metrics is available 48-96 hours after online publication and is updated daily on week days.
Initial download of the metrics may take a while.