Open Access
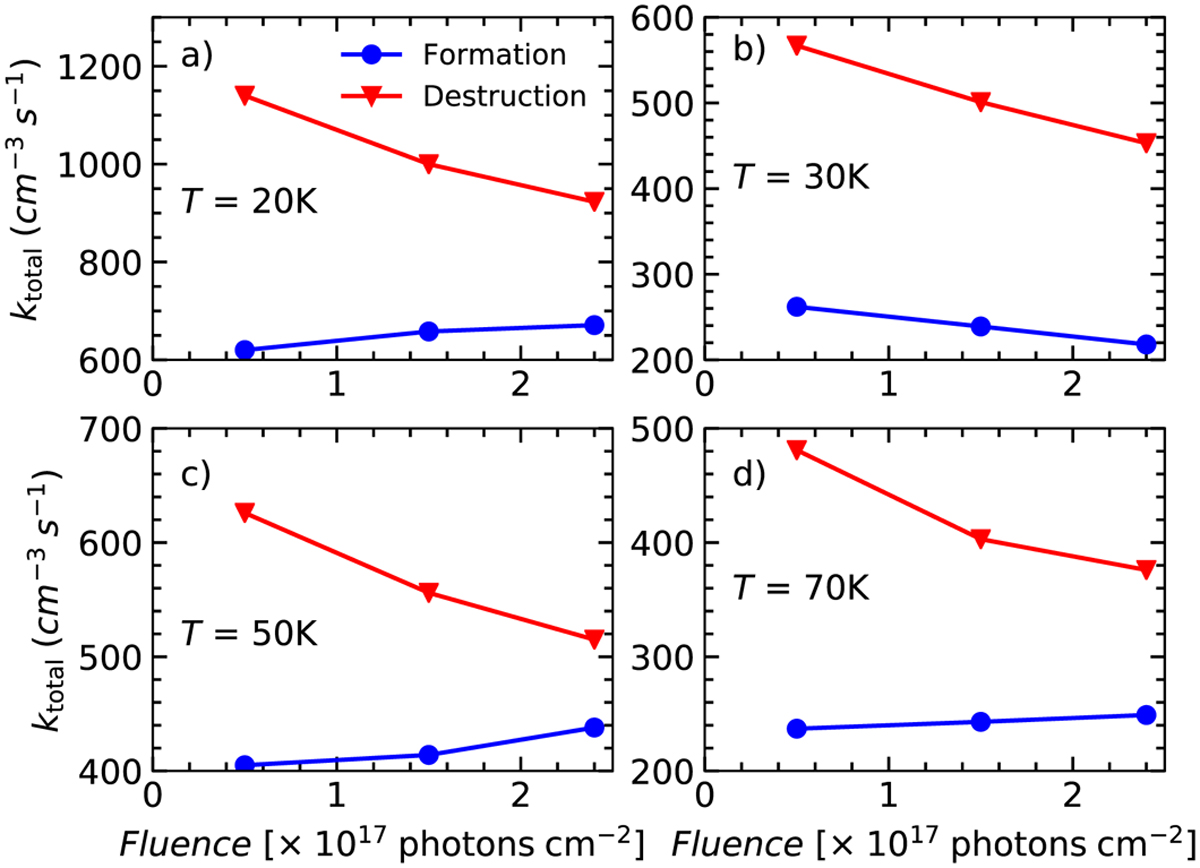
Fig. 8
Download original image
Total formation and destruction rates of CH3OH ice at selected fluences. Except at 30 K, the formation rate (blue line/symbols) increases with fluence while the destruction rate (red line/symbols) decreases. The lack of this trend at 30 K is attributed to the efficient reactive desorption at all fluences (see text).
Current usage metrics show cumulative count of Article Views (full-text article views including HTML views, PDF and ePub downloads, according to the available data) and Abstracts Views on Vision4Press platform.
Data correspond to usage on the plateform after 2015. The current usage metrics is available 48-96 hours after online publication and is updated daily on week days.
Initial download of the metrics may take a while.