Open Access
Fig. 4
Download original image
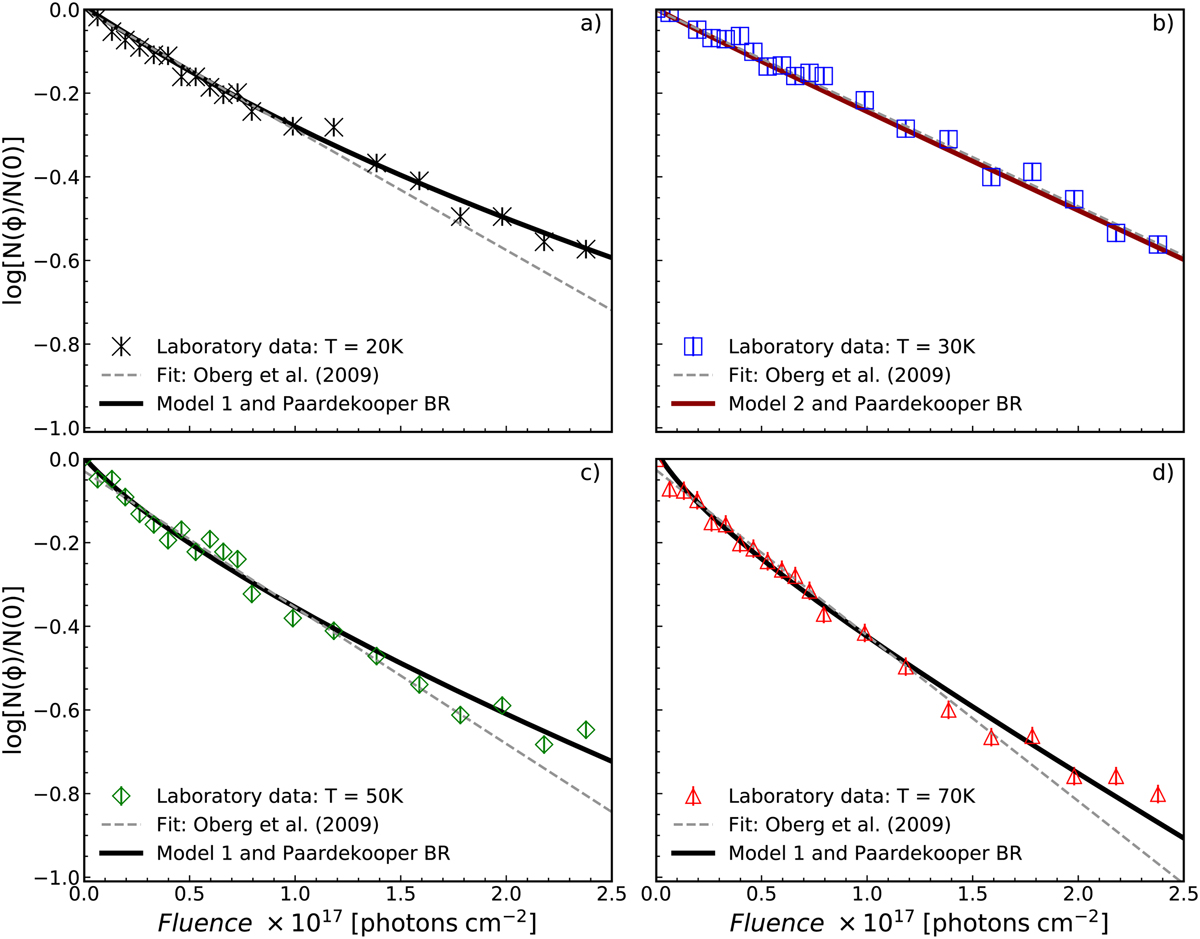
Natural logarithm of the normalized CH3OH ice column density as a function of the UV fluence at 20, 30, 50, and 70 K in panels a–d, respectively. The symbols show the laboratory data from Öberg et al. (2009a), and the lines indicate the models that match the experiments best.
Current usage metrics show cumulative count of Article Views (full-text article views including HTML views, PDF and ePub downloads, according to the available data) and Abstracts Views on Vision4Press platform.
Data correspond to usage on the plateform after 2015. The current usage metrics is available 48-96 hours after online publication and is updated daily on week days.
Initial download of the metrics may take a while.