Fig. 3
Download original image
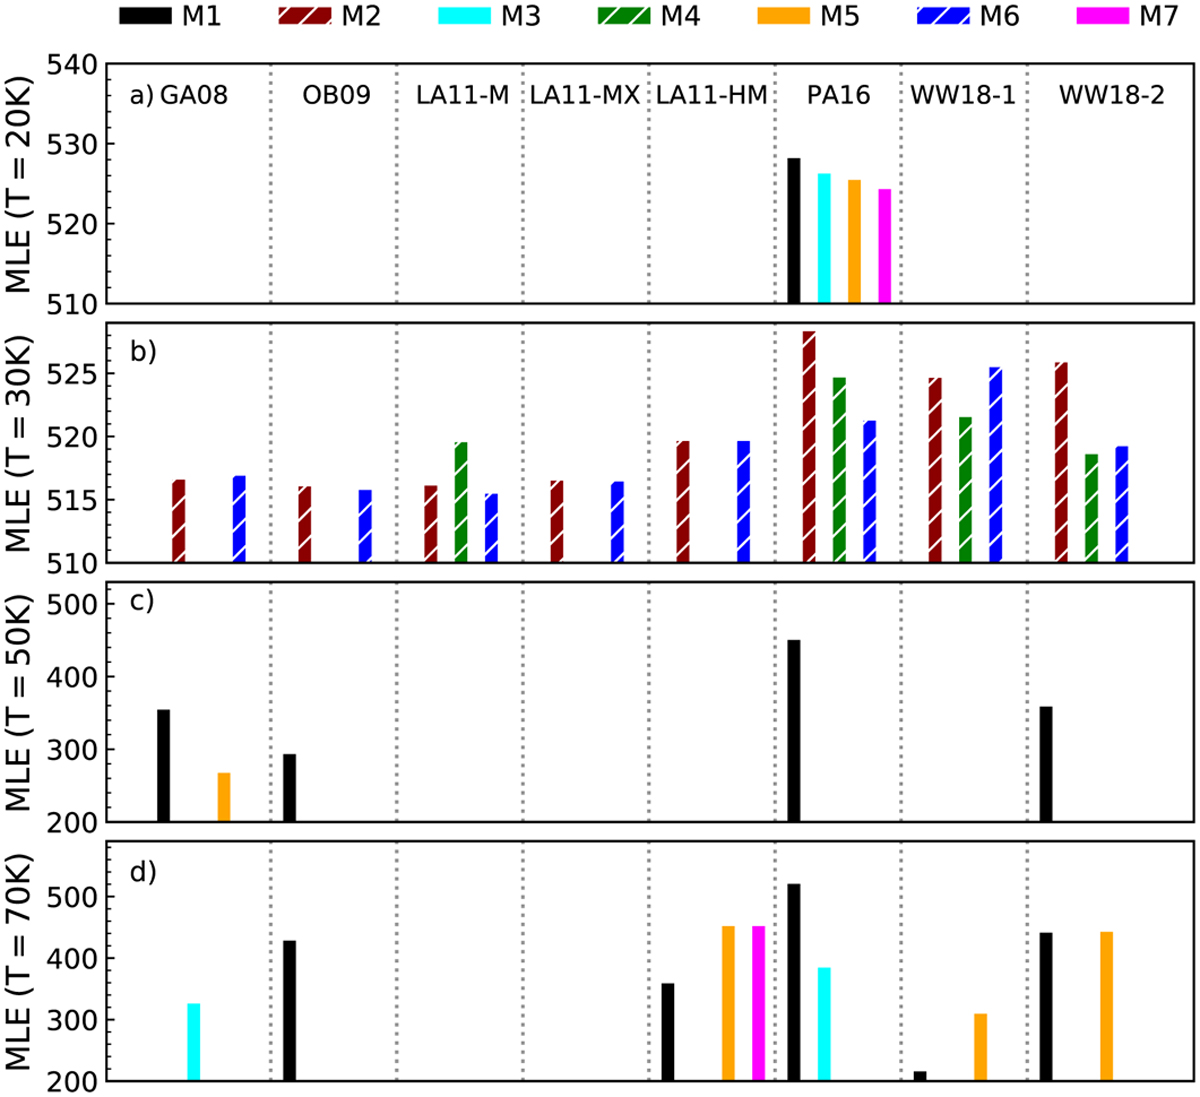
Accuracy of the CH3OH ice photodissociation fit for models 1–7. Higher bars indicate the best models. When no bars are shown, the MLE values are lower than the y-axis threshold. The hatched and solid bars indicate the models assuming the reactive desorption mechanism by Minissale et al. (2016) and Garrod et al. (2007), respectively.
Current usage metrics show cumulative count of Article Views (full-text article views including HTML views, PDF and ePub downloads, according to the available data) and Abstracts Views on Vision4Press platform.
Data correspond to usage on the plateform after 2015. The current usage metrics is available 48-96 hours after online publication and is updated daily on week days.
Initial download of the metrics may take a while.