Open Access
Fig. 3.
Download original image
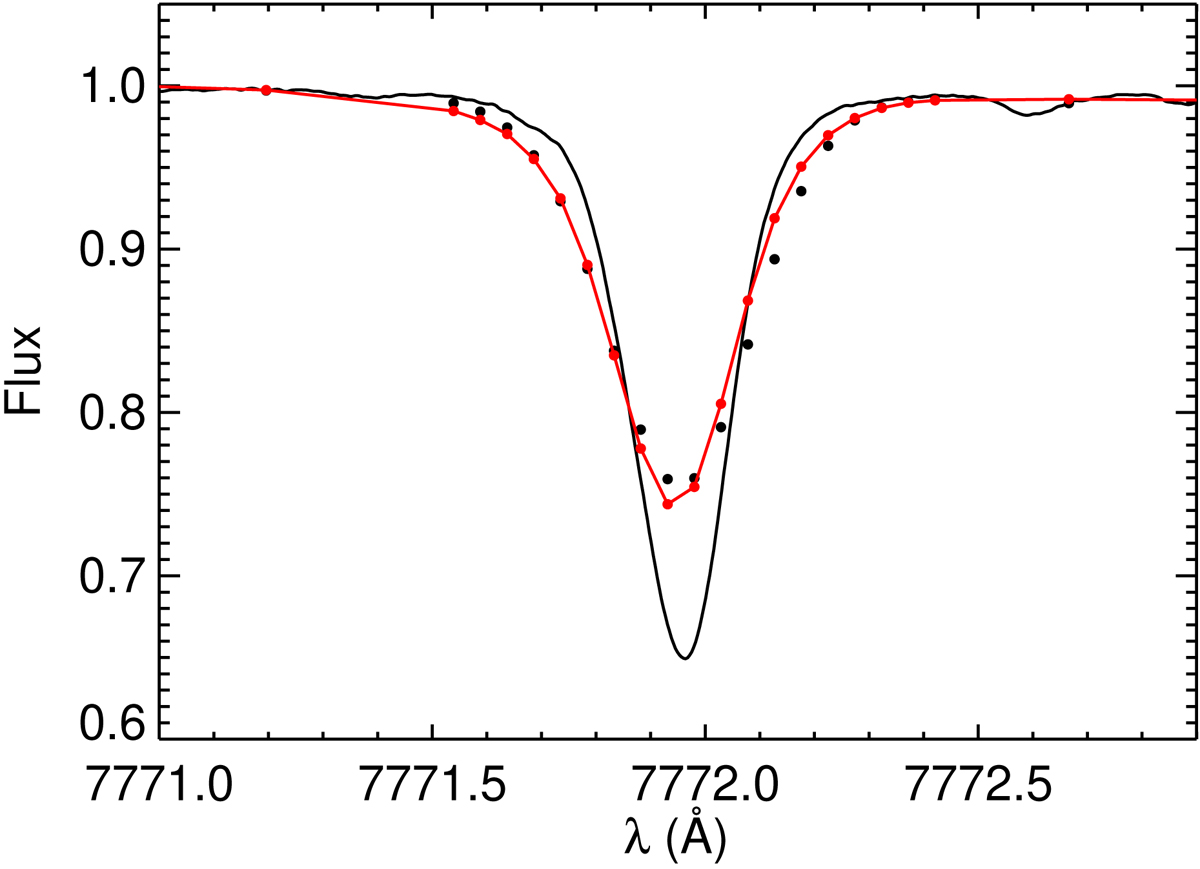
Comparison of the observed IAG and SST line profiles for the solar disk centre. The original IAG data are shown with the solid black line. The IAG data degraded to the sampling and resolving power of the SST data are shown with filled black circles. The SST data are shown with filled red circles connected by a red line.
Current usage metrics show cumulative count of Article Views (full-text article views including HTML views, PDF and ePub downloads, according to the available data) and Abstracts Views on Vision4Press platform.
Data correspond to usage on the plateform after 2015. The current usage metrics is available 48-96 hours after online publication and is updated daily on week days.
Initial download of the metrics may take a while.