Fig. 7.
Download original image
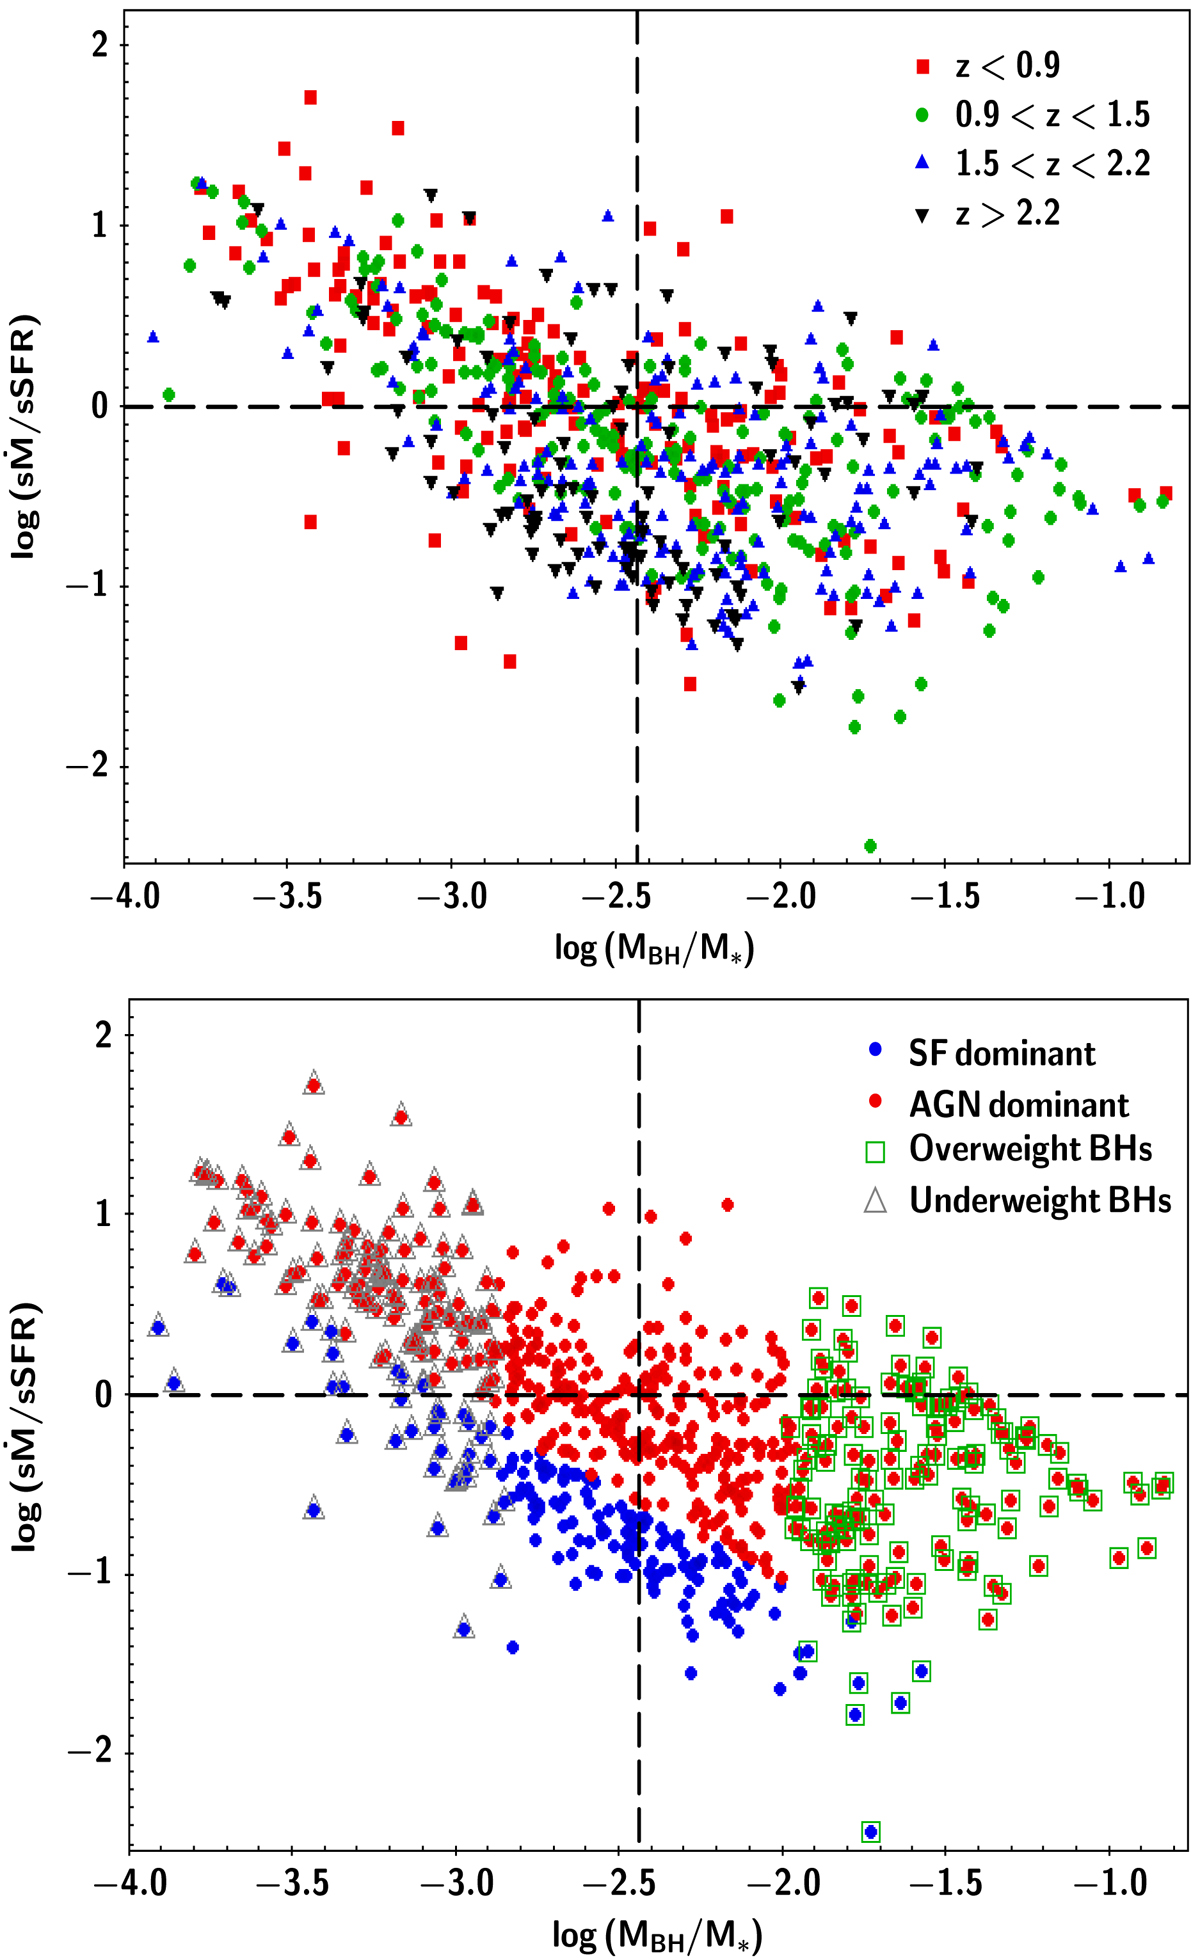
Distribution of AGN in the sṀ/sSFR–MBH/M* space. In the top panel, different colours and symbols correspond to a different redshift bin, as shown in the legend. The bottom panel presents the distribution of SF (blue circles) and AGN (red circles) in the sṀ/sSFR–MBH/M* space. Sources marked with a square are classified as galaxies with overweight SMBHs, while those marked with a triangle are classified as galaxies with underweight SMBHs. The classification is based on the location of the AGN in the MBH − M* plane relative to the line that describes the best fit on our MBH − M* measurements (see text and Fig. 4 for more details).
Current usage metrics show cumulative count of Article Views (full-text article views including HTML views, PDF and ePub downloads, according to the available data) and Abstracts Views on Vision4Press platform.
Data correspond to usage on the plateform after 2015. The current usage metrics is available 48-96 hours after online publication and is updated daily on week days.
Initial download of the metrics may take a while.