Fig. 6.
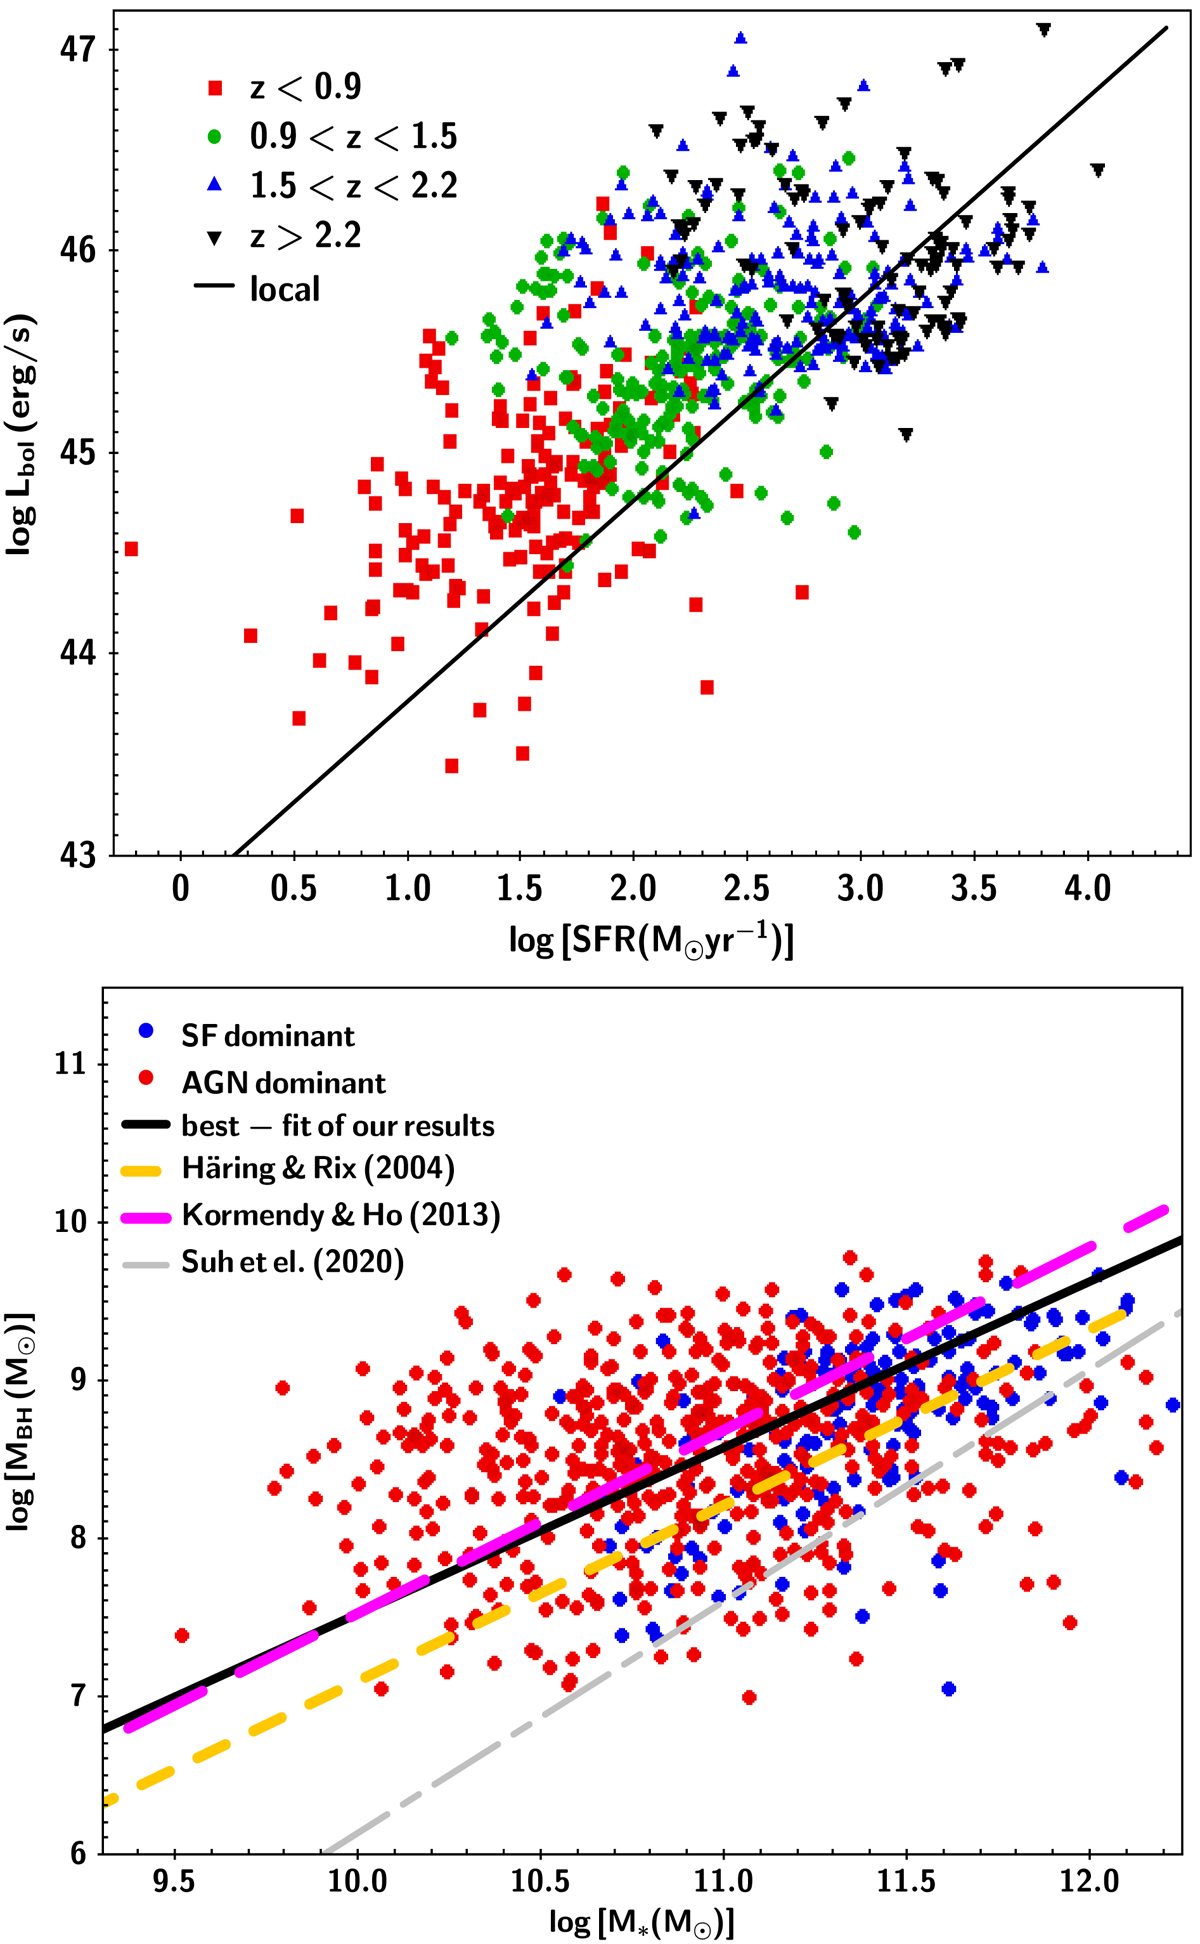
Download original image
Correlation of AGN and host galaxy properties. The top panel presents the Lbol as a function of SFR. Different symbols and colours correspond to different redshift intervals, as shown in the legend. The solid line indicates the local MBH − M* relation that would be expected from exactly simultaneous evolution of the SMBH and the host galaxy. AGN that lie above this line live in galaxies in which SMBH growth is dominant. AGN that lie below the line are systems in which galaxy growth dominates. The bottom panel shows the distribution of AGN (red circles) and SF (blue circles) dominant systems in the MBH − M* space. The dashed lines are the same as those used in Fig. 4.
Current usage metrics show cumulative count of Article Views (full-text article views including HTML views, PDF and ePub downloads, according to the available data) and Abstracts Views on Vision4Press platform.
Data correspond to usage on the plateform after 2015. The current usage metrics is available 48-96 hours after online publication and is updated daily on week days.
Initial download of the metrics may take a while.