Open Access
Fig. 1.
Download original image
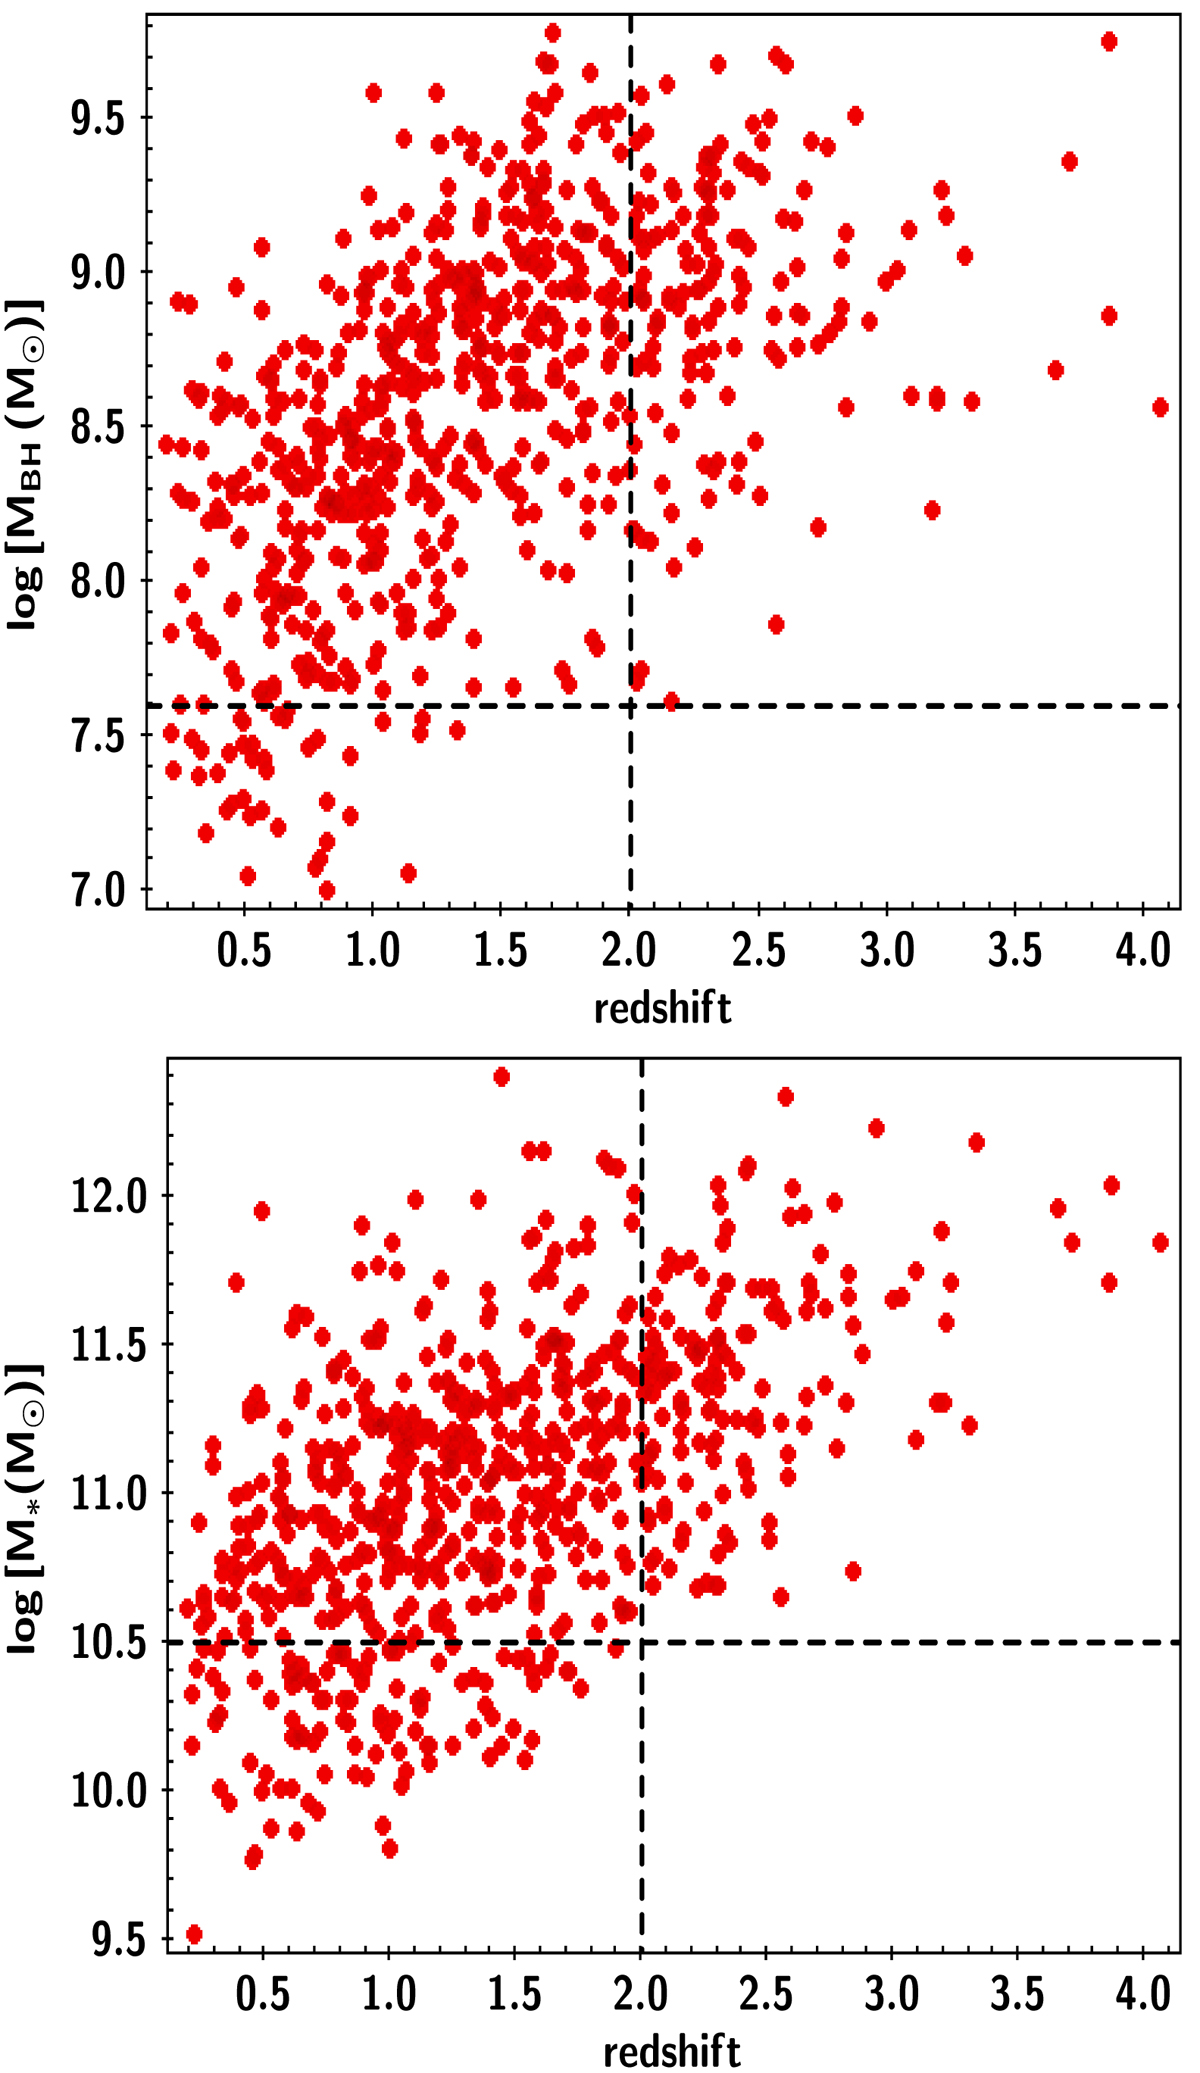
SMBH and galaxy properties as a function of redshift. Top panel: MBH vs. redshift. Bottom panel: M* vs. redshift. The dashed horizontal lines show the MBH (top panel) and M* (bottom panel) limits to which our sample is complete up to redshift 2 (vertical lines). For more details, readers can refer to Sect. 3.3.
Current usage metrics show cumulative count of Article Views (full-text article views including HTML views, PDF and ePub downloads, according to the available data) and Abstracts Views on Vision4Press platform.
Data correspond to usage on the plateform after 2015. The current usage metrics is available 48-96 hours after online publication and is updated daily on week days.
Initial download of the metrics may take a while.