Open Access
Fig. A.1
Download original image
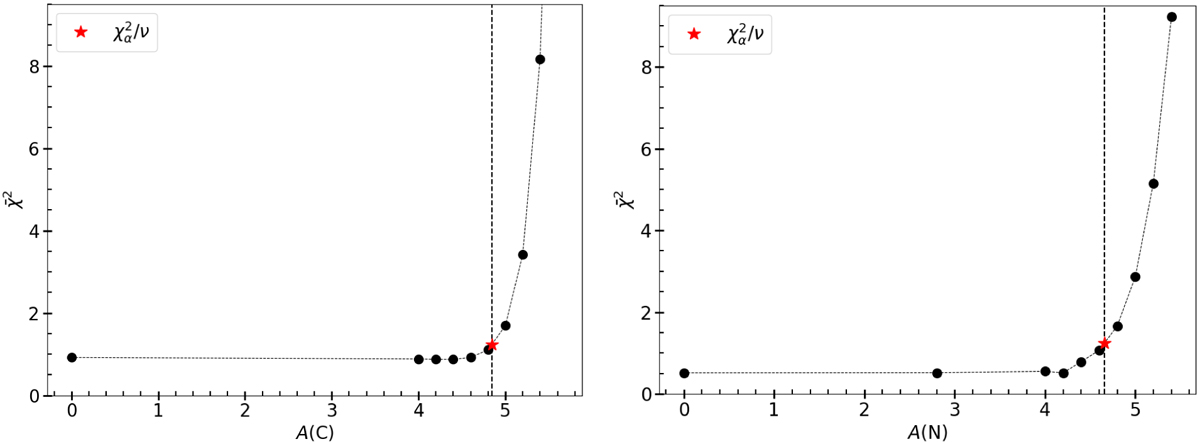
Overview of the ![]() values from the upper limit analysis described in Sect. 3.2. Th top panel corresponds to the different synthetic spectra of CH and the bottom panel to NH. The red star represents the interpolated abundance where
values from the upper limit analysis described in Sect. 3.2. Th top panel corresponds to the different synthetic spectra of CH and the bottom panel to NH. The red star represents the interpolated abundance where ![]() , which is also highlighted with a vertical dashed line.
, which is also highlighted with a vertical dashed line.
Current usage metrics show cumulative count of Article Views (full-text article views including HTML views, PDF and ePub downloads, according to the available data) and Abstracts Views on Vision4Press platform.
Data correspond to usage on the plateform after 2015. The current usage metrics is available 48-96 hours after online publication and is updated daily on week days.
Initial download of the metrics may take a while.