Fig. 7
Download original image
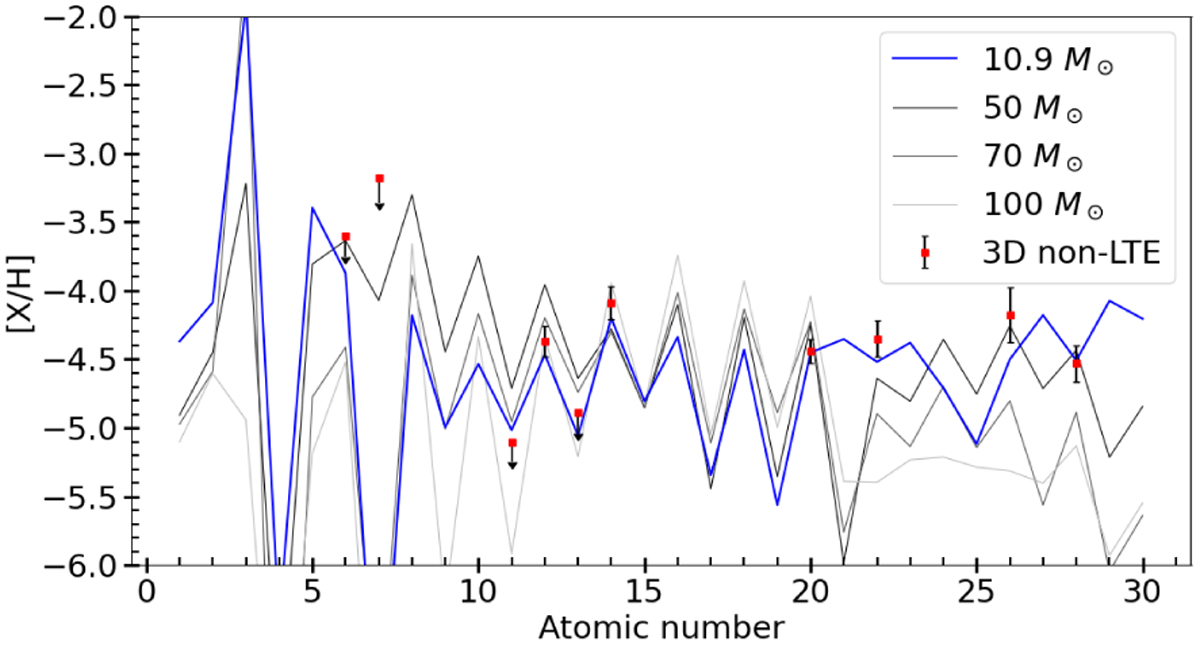
Impact of progenitor mass on the supernova yields as compared to the best-fitting model. Three-dimensional non-LTE abundances from this paper are shown as red squares together with the best-fitting progenitor supernova model in blue and three other models with a higher progenitor mass in grey: M = 50, 70, 100 M⊙, E51 = 0.3 and fmix = 0.25.
Current usage metrics show cumulative count of Article Views (full-text article views including HTML views, PDF and ePub downloads, according to the available data) and Abstracts Views on Vision4Press platform.
Data correspond to usage on the plateform after 2015. The current usage metrics is available 48-96 hours after online publication and is updated daily on week days.
Initial download of the metrics may take a while.