Fig. 6
Download original image
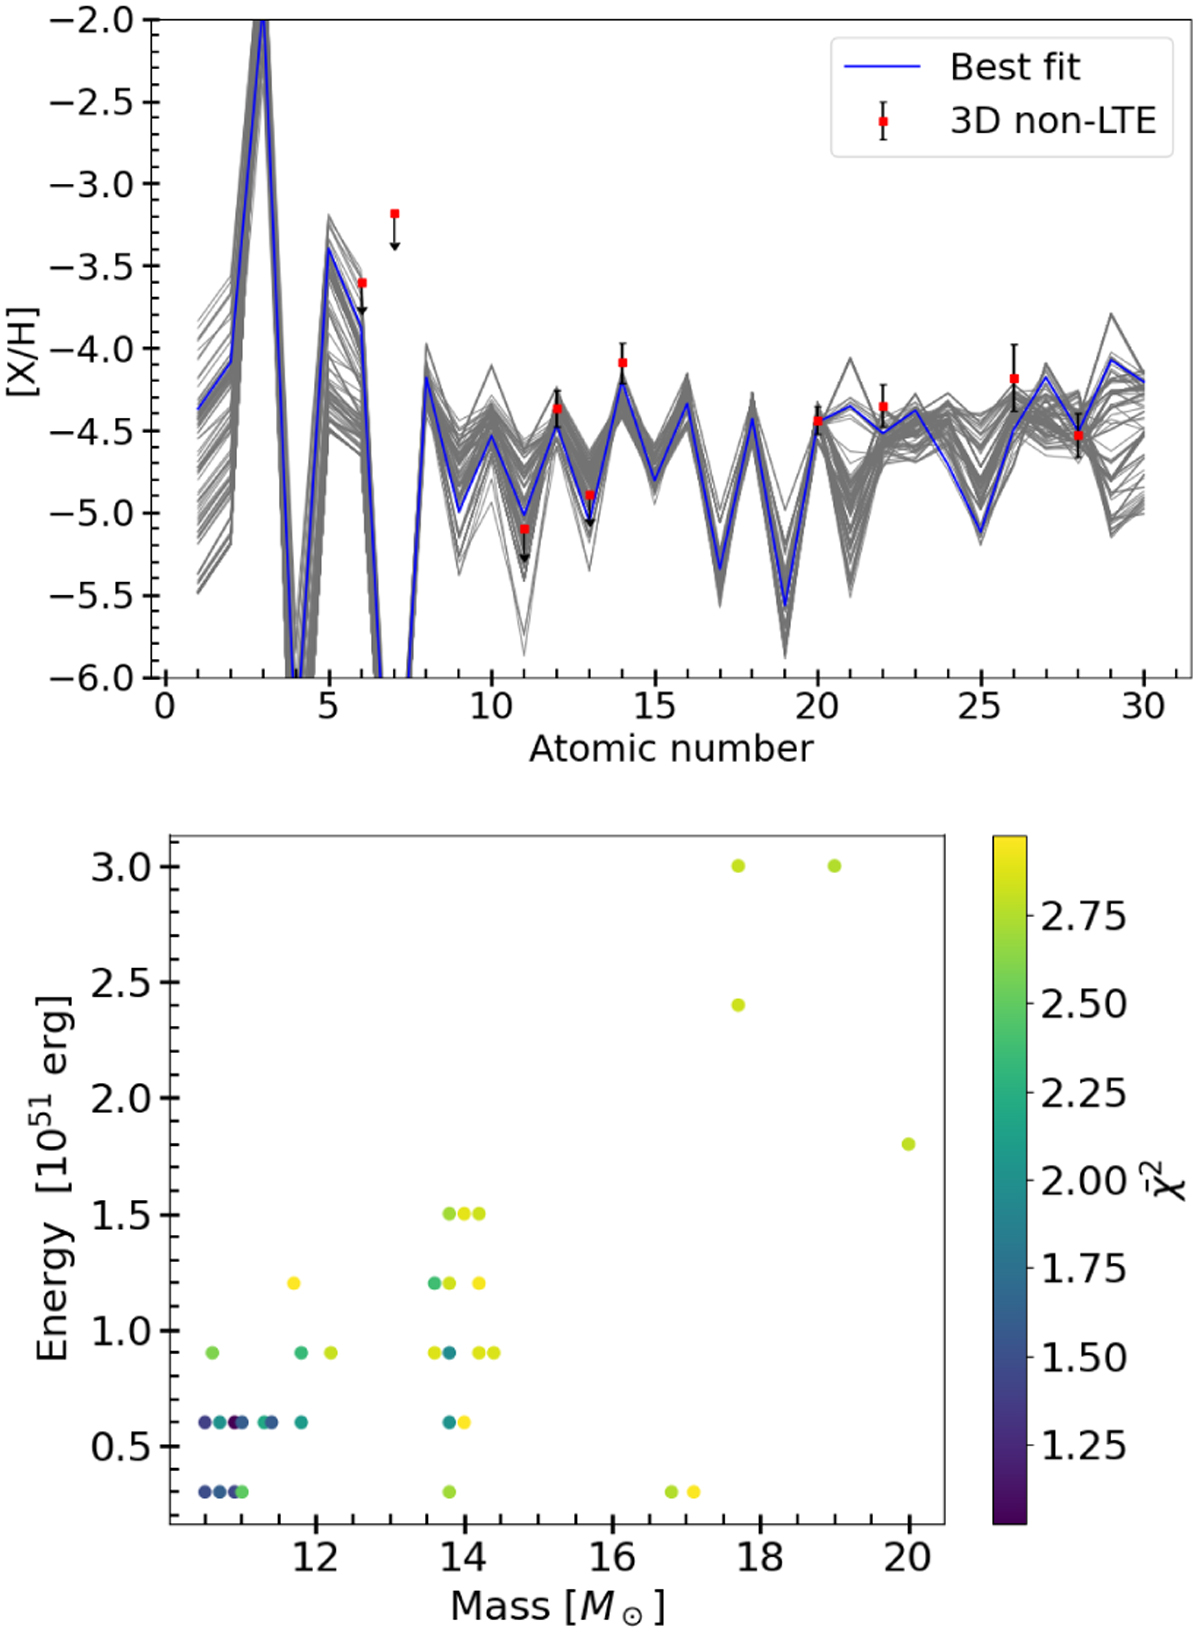
Visualisation of the STARFIT fitting analysis for all models with ![]() . The top panel shows the 3D non-LTE abundances (red squares) together with all the best-fitting supernovae models (grey lines), and the best fit (blue line). The bottom panel shows the progenitor mass and explosion energy for the same best-fitting models shown in the top panel along with their respective
. The top panel shows the 3D non-LTE abundances (red squares) together with all the best-fitting supernovae models (grey lines), and the best fit (blue line). The bottom panel shows the progenitor mass and explosion energy for the same best-fitting models shown in the top panel along with their respective ![]() values.
values.
Current usage metrics show cumulative count of Article Views (full-text article views including HTML views, PDF and ePub downloads, according to the available data) and Abstracts Views on Vision4Press platform.
Data correspond to usage on the plateform after 2015. The current usage metrics is available 48-96 hours after online publication and is updated daily on week days.
Initial download of the metrics may take a while.