Fig. 2
Download original image
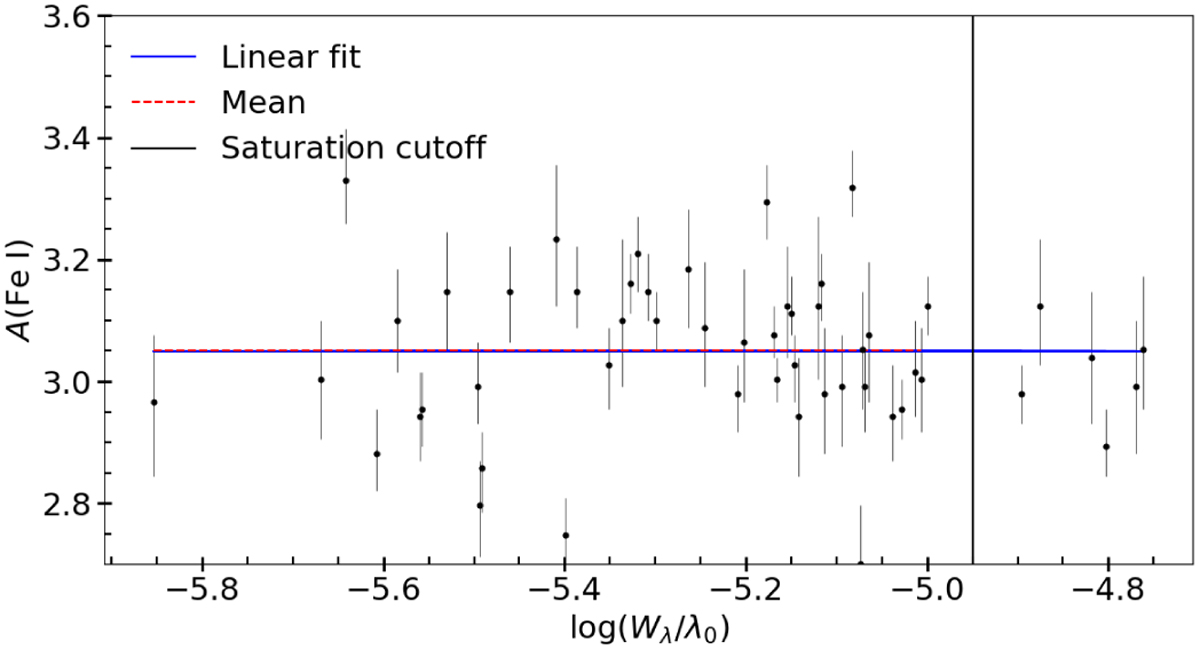
One-dimensional non-LTE Fe I abundances for each visible line in the spectrum interpolated to a microturbulence of υmicro = 1.48 km s−1. The blue line shows the best linear fit through the data, while the red dashed line denotes the mean non-LTE abundance. The black solid line denotes the cut-off in reduced equivalent width between saturated and non-saturated lines: log[Wλ/λ0] < −4.95.
Current usage metrics show cumulative count of Article Views (full-text article views including HTML views, PDF and ePub downloads, according to the available data) and Abstracts Views on Vision4Press platform.
Data correspond to usage on the plateform after 2015. The current usage metrics is available 48-96 hours after online publication and is updated daily on week days.
Initial download of the metrics may take a while.