Fig. 5
Download original image
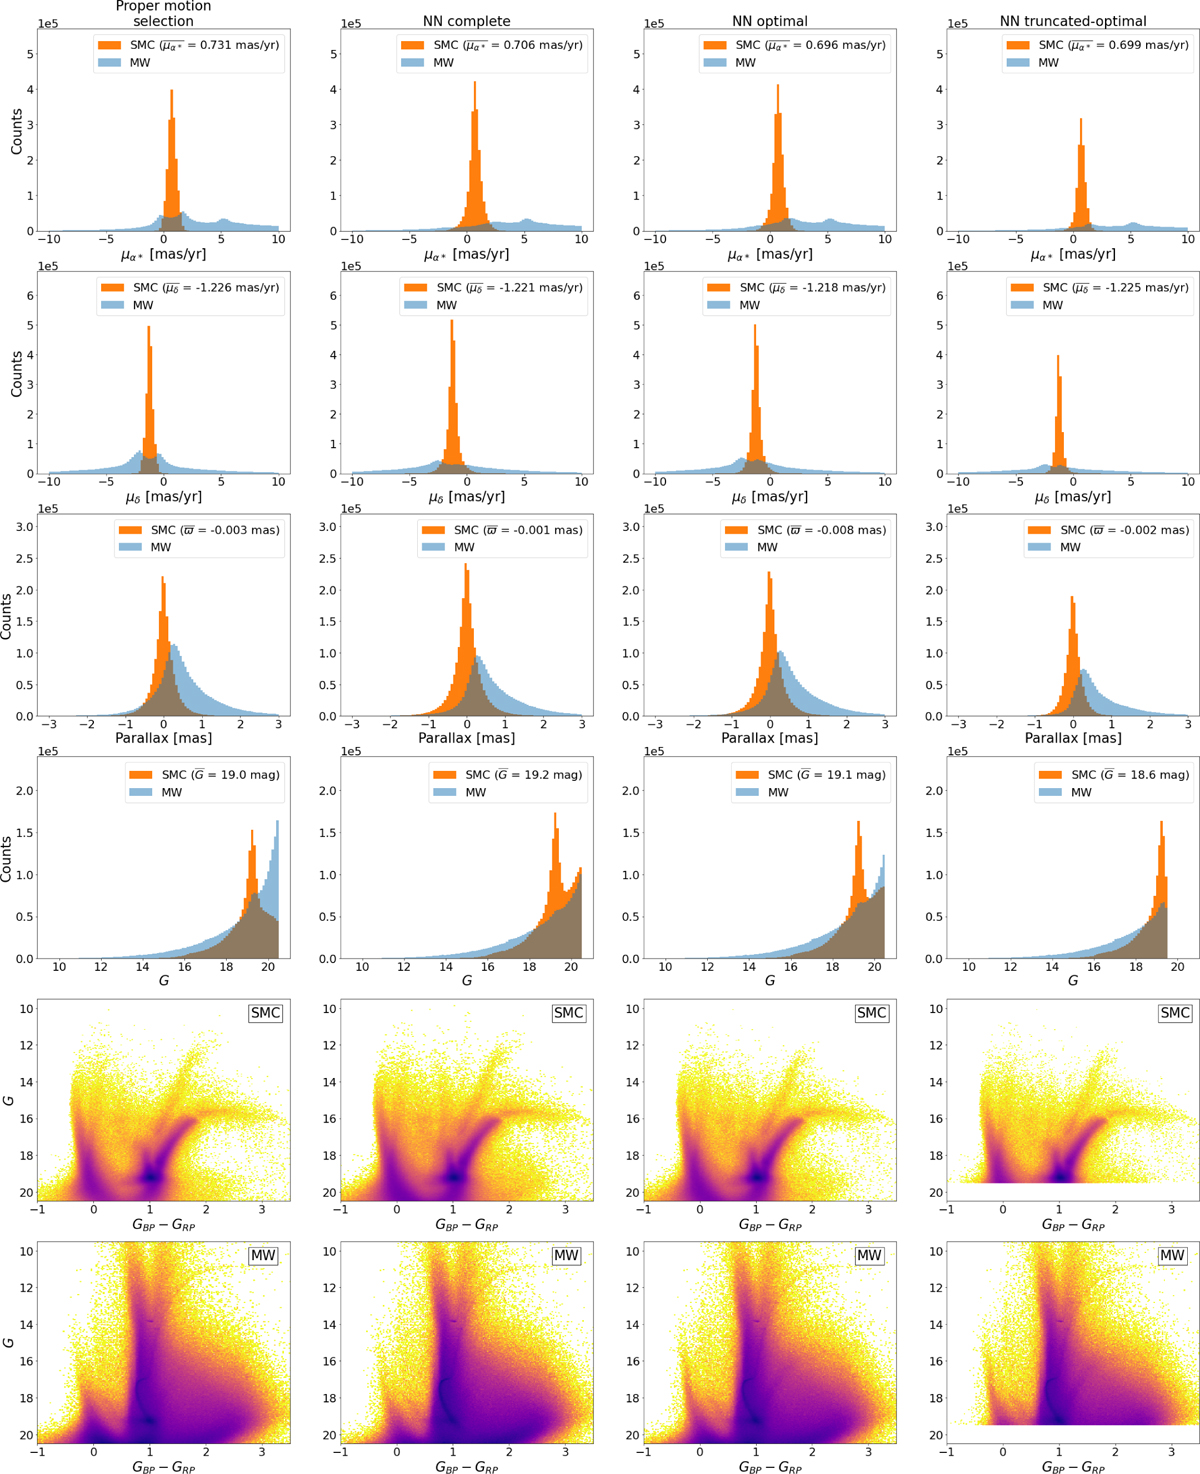
Astrometric and photometric characteristics of the SMC and MW samples. From left to right: PM sample, NN complete, NN optimal, and NN truncated-optimal samples. In the first four rows, we show distributions of proper motion in right ascension and declination, parallax, and G-magnitude, respectively, of the SMC (orange) and MW (blue) samples. In the last two rows, we show the color–magnitude diagram of the samples classified as SMC and MW, respectively. Color represents the relative stellar density, with darker colors meaning higher densities.
Current usage metrics show cumulative count of Article Views (full-text article views including HTML views, PDF and ePub downloads, according to the available data) and Abstracts Views on Vision4Press platform.
Data correspond to usage on the plateform after 2015. The current usage metrics is available 48-96 hours after online publication and is updated daily on week days.
Initial download of the metrics may take a while.