Fig. 9
Download original image
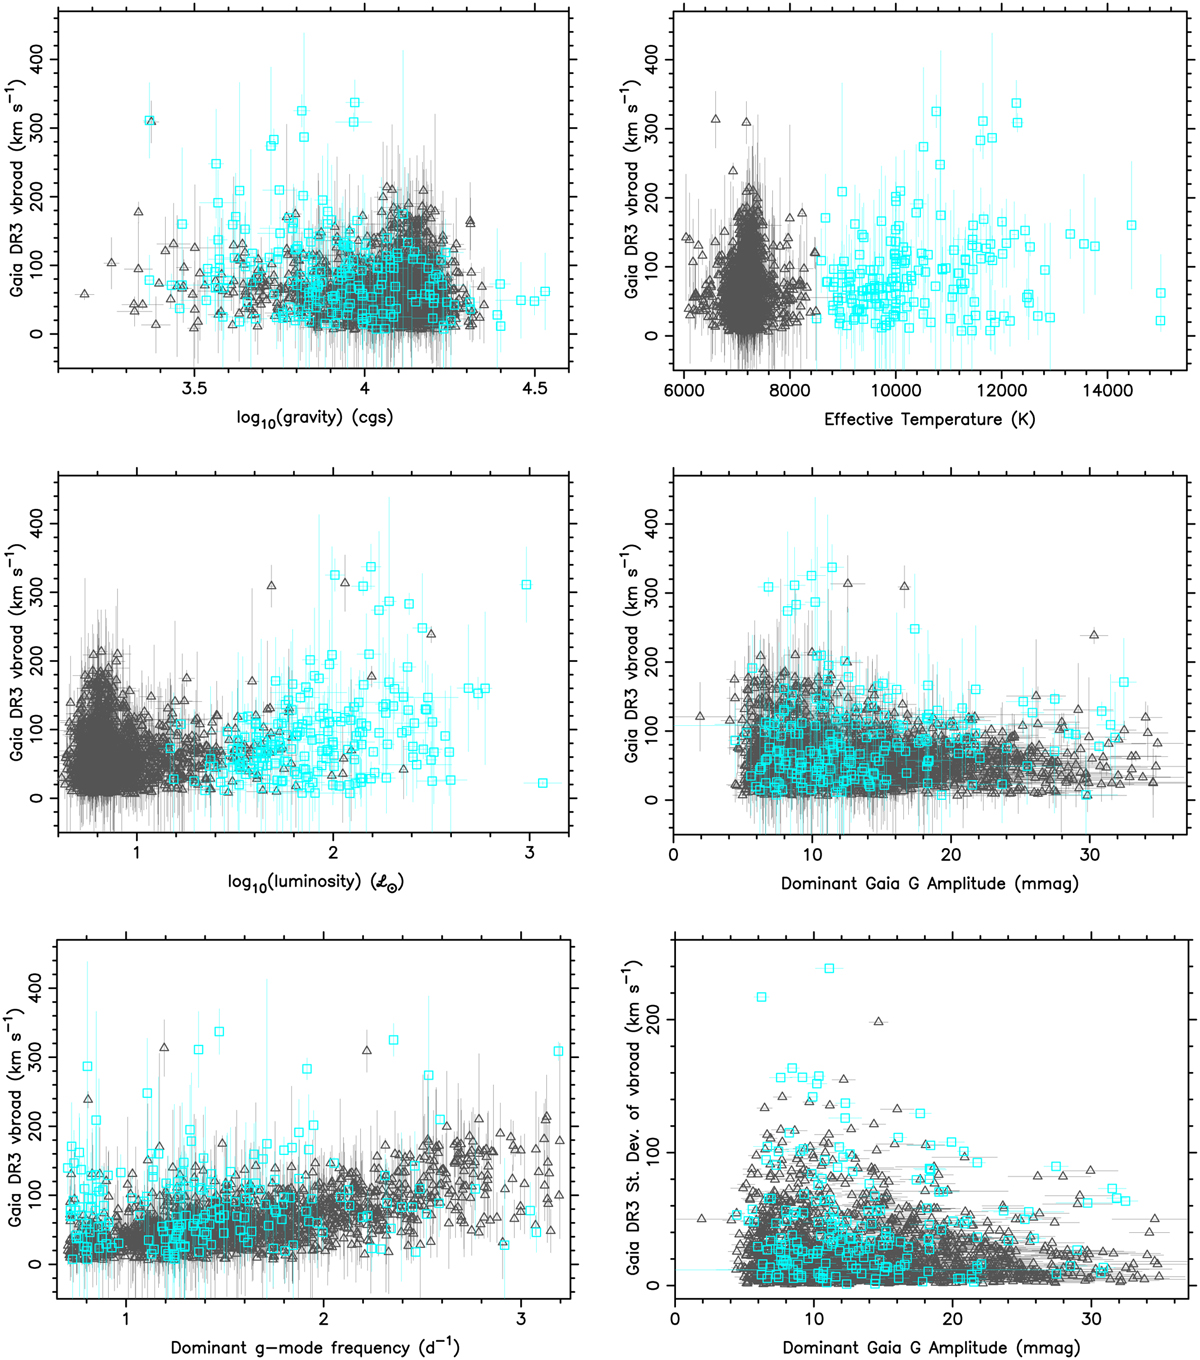
Gaia DR3 measurements of vbroad versus each of the five covariates as indicated for the 1775 γ Dor (grey triangles) and 190 SPB (cyan squares) stars having these quantities available. The lower right panel shows the standard deviation of vbroad as a function of the dominant ɡ-mode amplitude. When invisible, the errors are smaller than the symbol sizes.
Current usage metrics show cumulative count of Article Views (full-text article views including HTML views, PDF and ePub downloads, according to the available data) and Abstracts Views on Vision4Press platform.
Data correspond to usage on the plateform after 2015. The current usage metrics is available 48-96 hours after online publication and is updated daily on week days.
Initial download of the metrics may take a while.