Open Access
Fig. 5.
Download original image
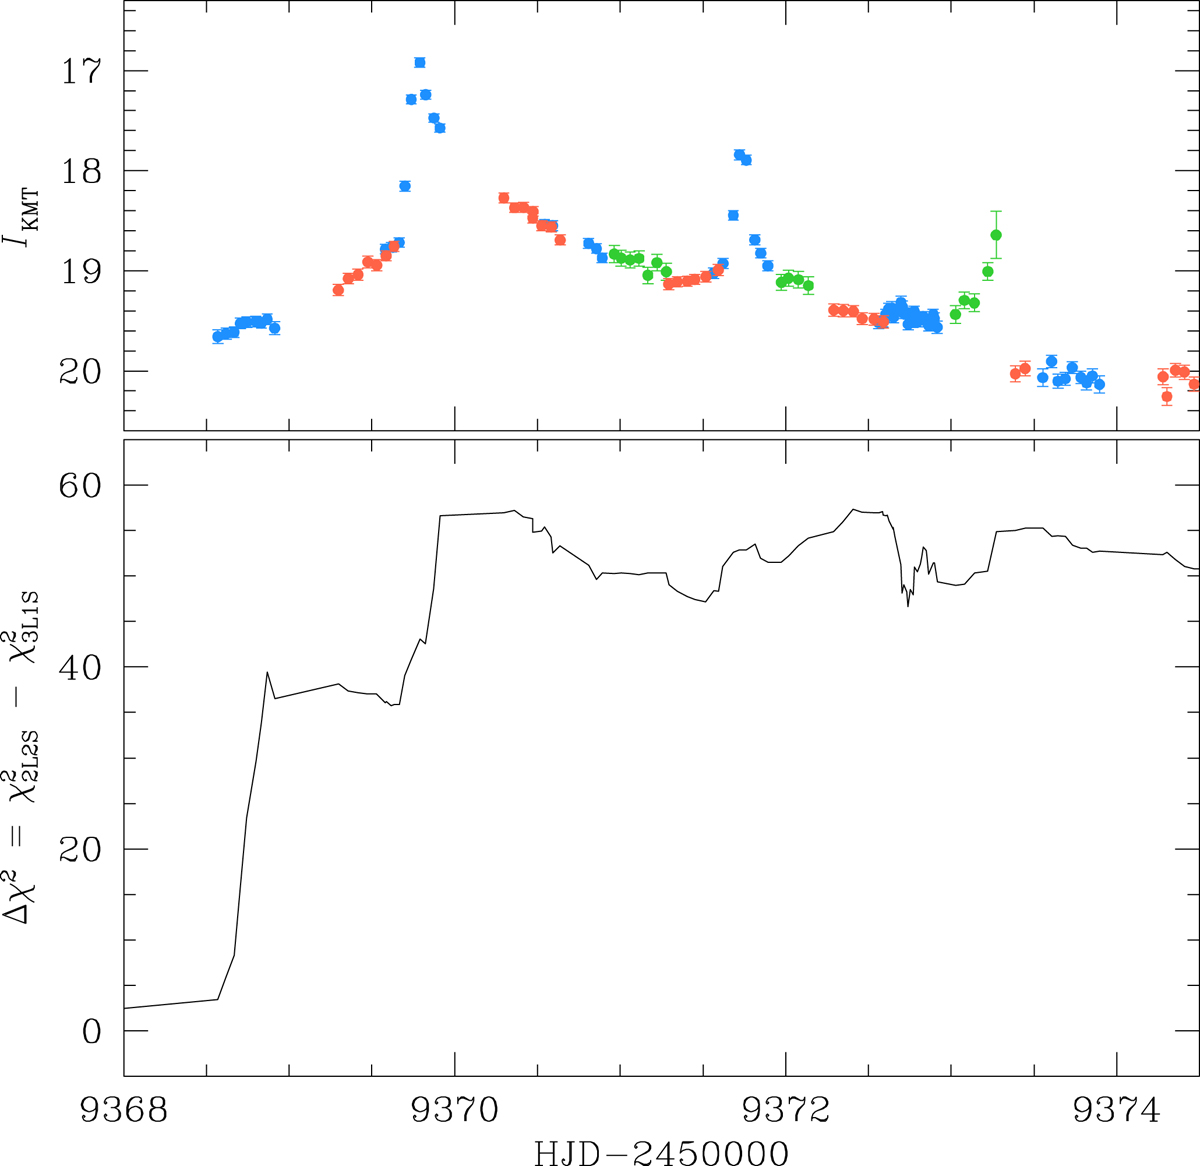
Cumulative distribution of the χ2 difference, ![]() , between the 2L2S (orbital) and 3L1S models in the region of the major anomaly. The light curve in the upper panel is shown to indicate the epochs of major χ2 differences.
, between the 2L2S (orbital) and 3L1S models in the region of the major anomaly. The light curve in the upper panel is shown to indicate the epochs of major χ2 differences.
Current usage metrics show cumulative count of Article Views (full-text article views including HTML views, PDF and ePub downloads, according to the available data) and Abstracts Views on Vision4Press platform.
Data correspond to usage on the plateform after 2015. The current usage metrics is available 48-96 hours after online publication and is updated daily on week days.
Initial download of the metrics may take a while.