Fig. 4.
Download original image
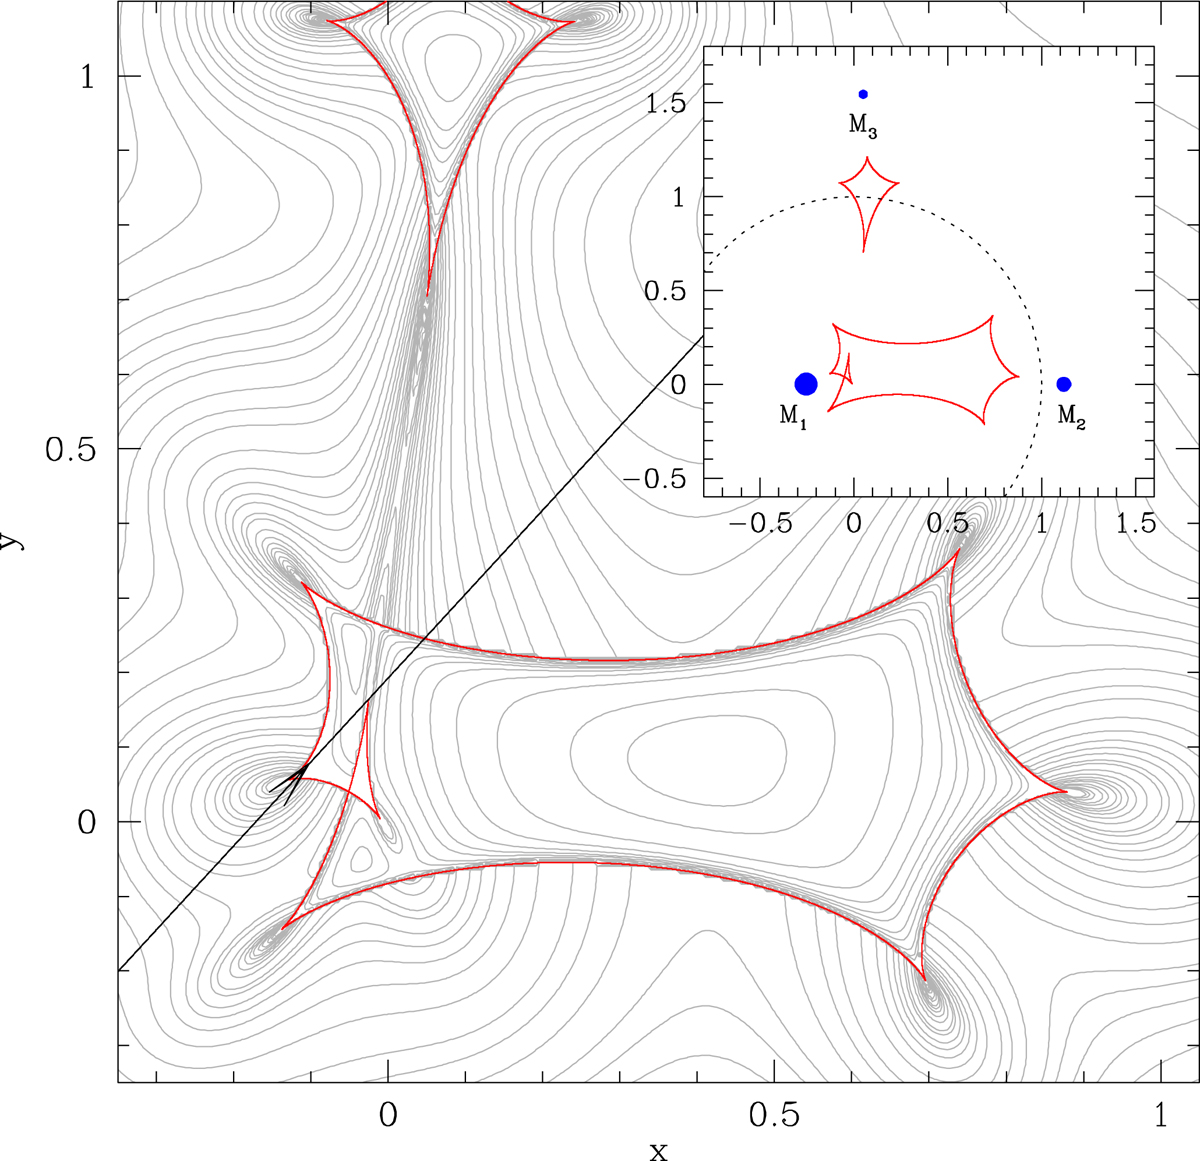
Lens-system configuration of the 3L1S model. The main panel shows the central anomaly region, and the inset displays the whole view of the lens system, where blue dots marked by M1, M2, and M3 denote the positions of the individual lens components. Gray curves around the caustic represent the equi-magnification contours. The dotted circle centered at the origin of the coordinates represents the Einstein ring of the lens system.
Current usage metrics show cumulative count of Article Views (full-text article views including HTML views, PDF and ePub downloads, according to the available data) and Abstracts Views on Vision4Press platform.
Data correspond to usage on the plateform after 2015. The current usage metrics is available 48-96 hours after online publication and is updated daily on week days.
Initial download of the metrics may take a while.