Fig. 3.
Download original image
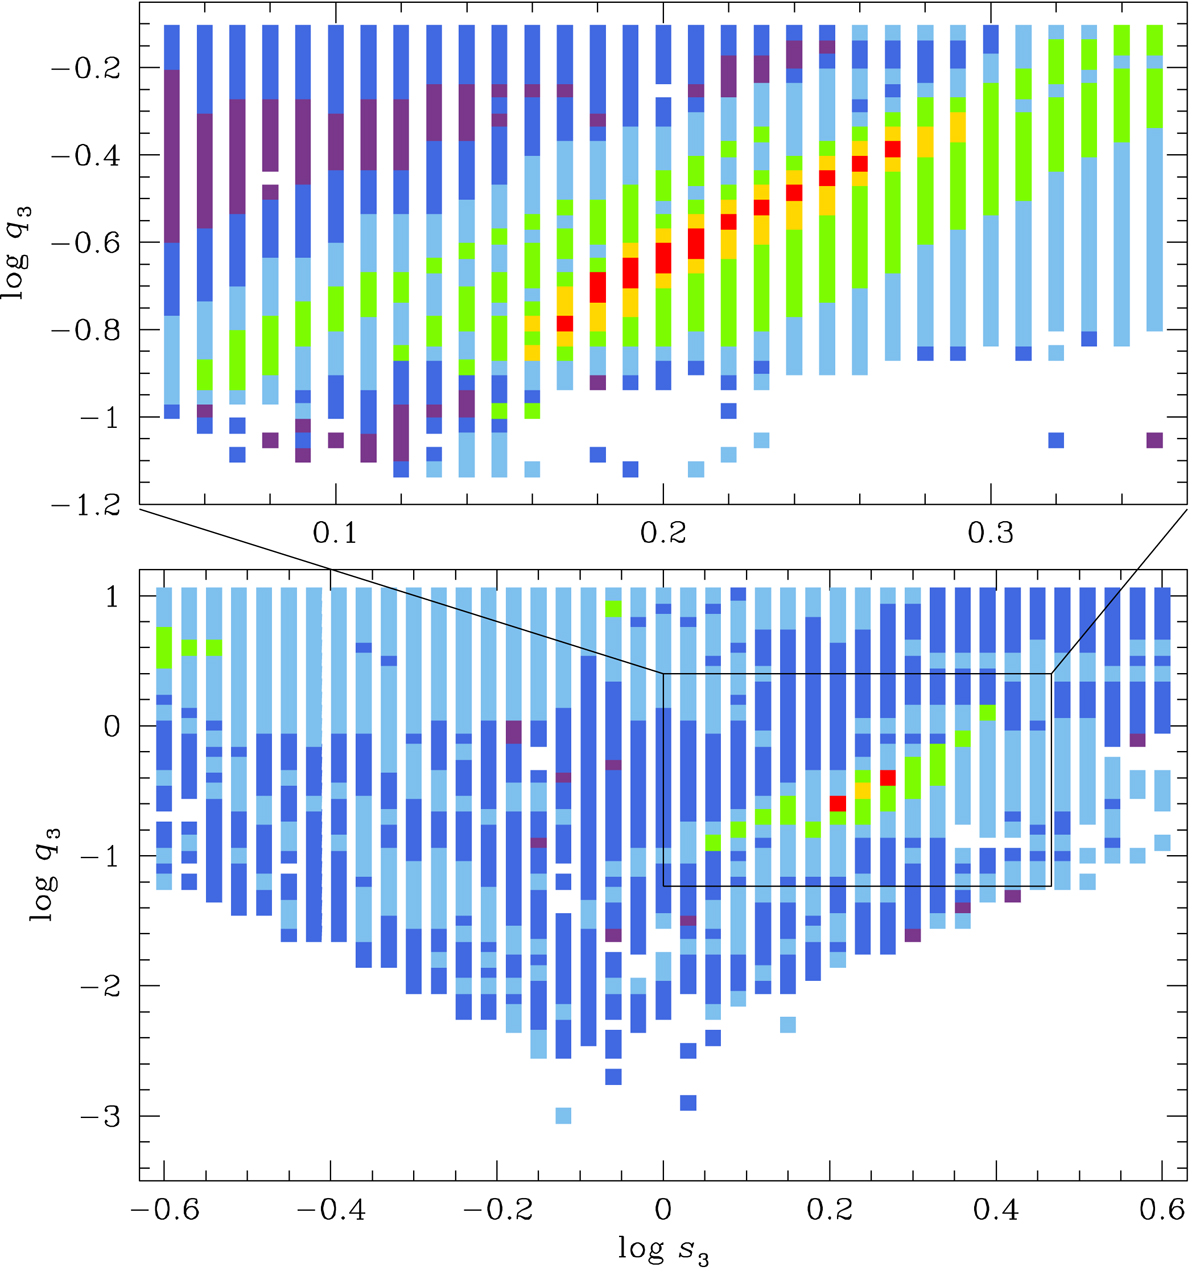
Map of Δχ2 on the log s3–log q3 parameter plane obtained from the initial grid searches for (s3, q3) parameters. Color coding is used to differentiate between points with ≤1nσ (red), ≤2nσ (yellow), ≤3nσ (green), ≤4nσ (cyan), ≤5nσ (blue), and ≤6nσ (purple), where n = 9. The upper panel shows the map around the minima constructed with denser grids.
Current usage metrics show cumulative count of Article Views (full-text article views including HTML views, PDF and ePub downloads, according to the available data) and Abstracts Views on Vision4Press platform.
Data correspond to usage on the plateform after 2015. The current usage metrics is available 48-96 hours after online publication and is updated daily on week days.
Initial download of the metrics may take a while.