Fig. 2.
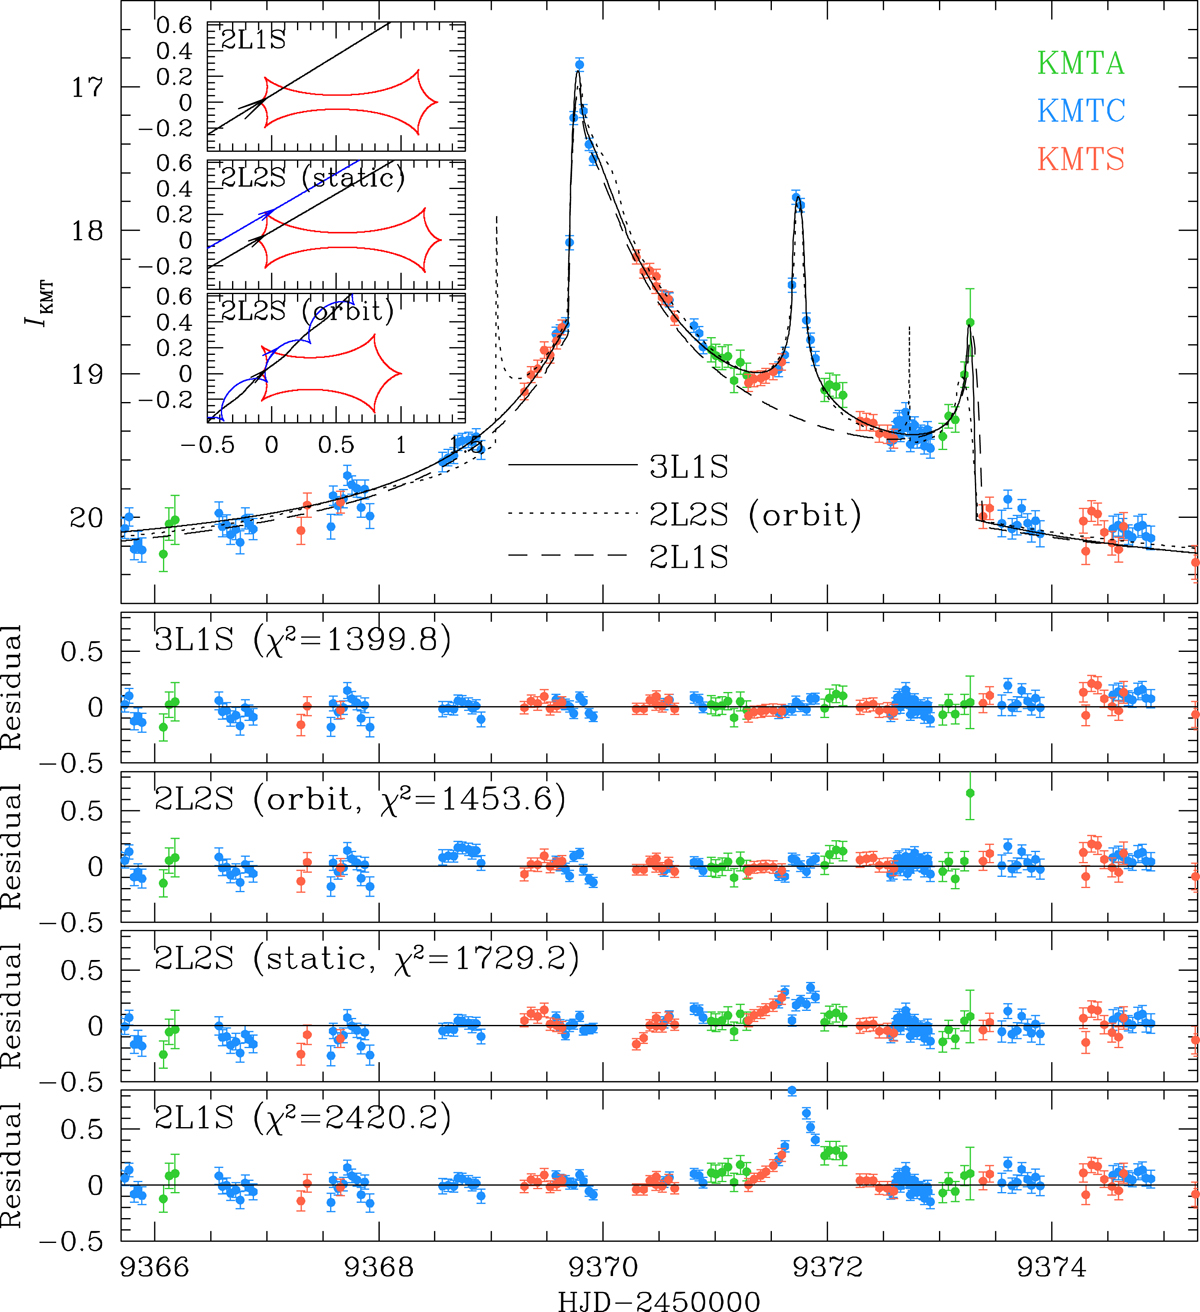
Download original image
Enlarged view around the central anomaly region of the light curve. Three model curves obtained under the 3L1S, 2L2S, and 2L1S lens-system configurations are drawn over the data points, and the three lower panels show the residuals from the individual models. The two insets in the top panel show the lens-system configurations of the 2L1S and 2L2S models. In each inset, the red figure is the caustic and the line with an arrow represents the source trajectory. For the 2L2S configuration, there are two source trajectories, in which the black and blue ones represent the trajectories of the primary and secondary source stars, respectively.
Current usage metrics show cumulative count of Article Views (full-text article views including HTML views, PDF and ePub downloads, according to the available data) and Abstracts Views on Vision4Press platform.
Data correspond to usage on the plateform after 2015. The current usage metrics is available 48-96 hours after online publication and is updated daily on week days.
Initial download of the metrics may take a while.