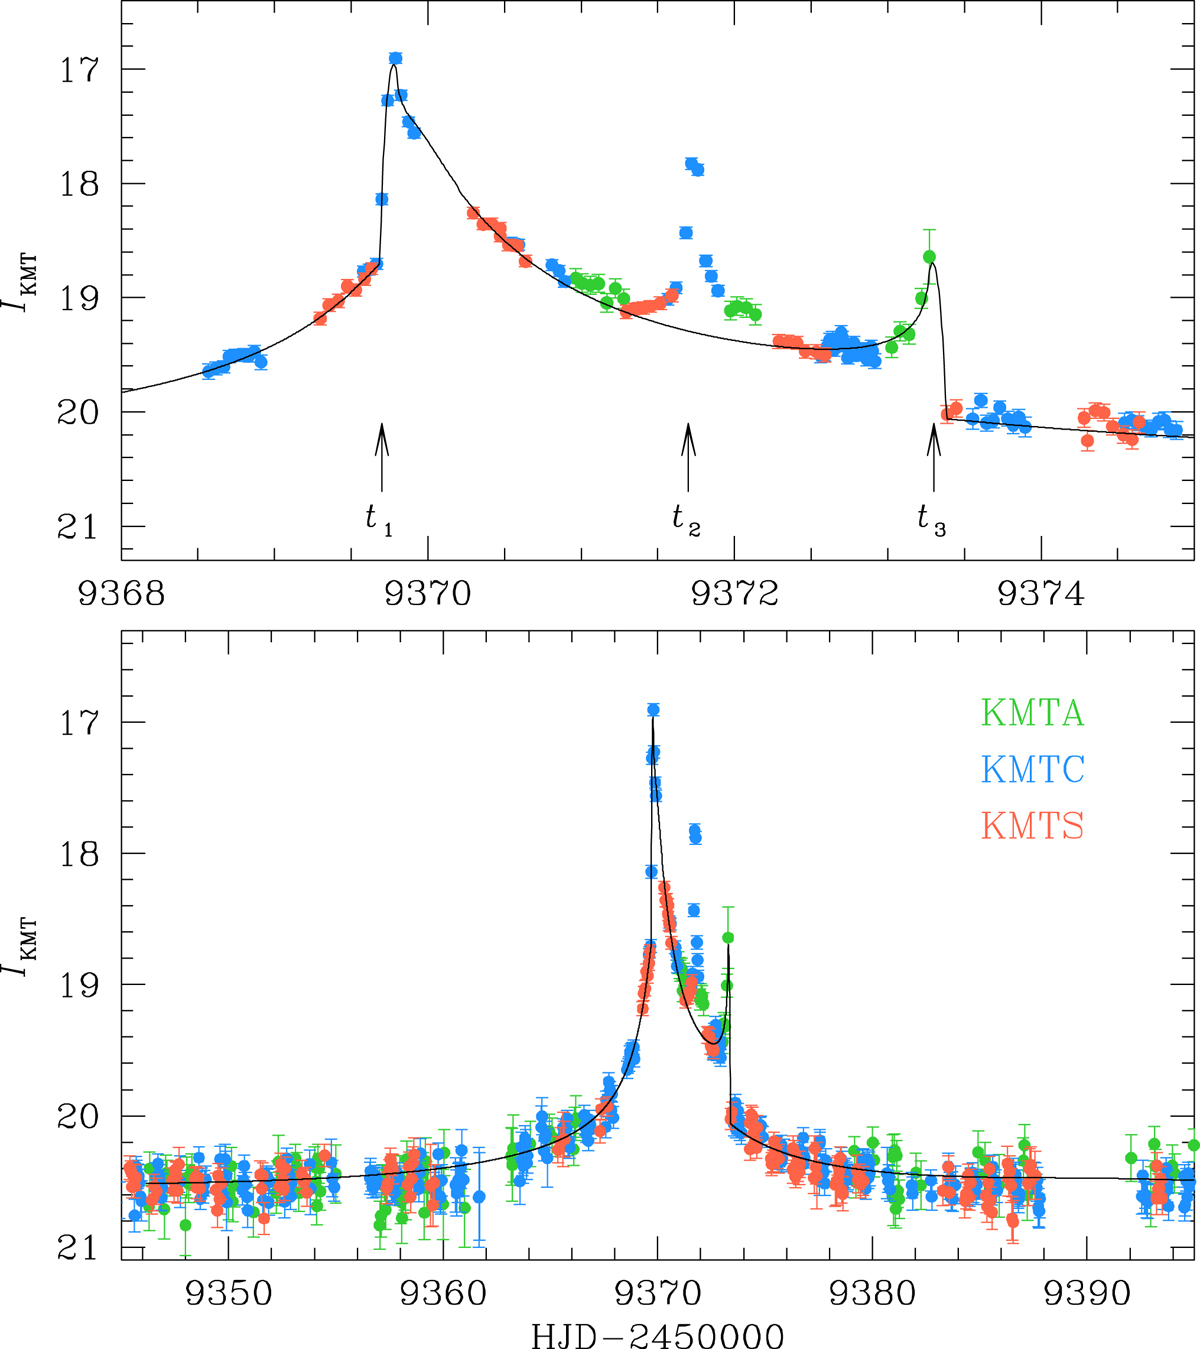
Fig. 1.
Download original image
Light curve of KMT-2021-BLG-1122 constructed with the combined data obtained from the three KMTNet telescopes (KMTA, KMTC, and KMTS). The curve drawn over the data points is the best-fit model found under the 2L1S interpretation. The lower panel displays the whole view, and the upper panel shows the enlarged view of the anomaly region. The epochs marked by t1, t2, and t3 indicate the three major anomaly features.
Current usage metrics show cumulative count of Article Views (full-text article views including HTML views, PDF and ePub downloads, according to the available data) and Abstracts Views on Vision4Press platform.
Data correspond to usage on the plateform after 2015. The current usage metrics is available 48-96 hours after online publication and is updated daily on week days.
Initial download of the metrics may take a while.