Fig. 9.
Download original image
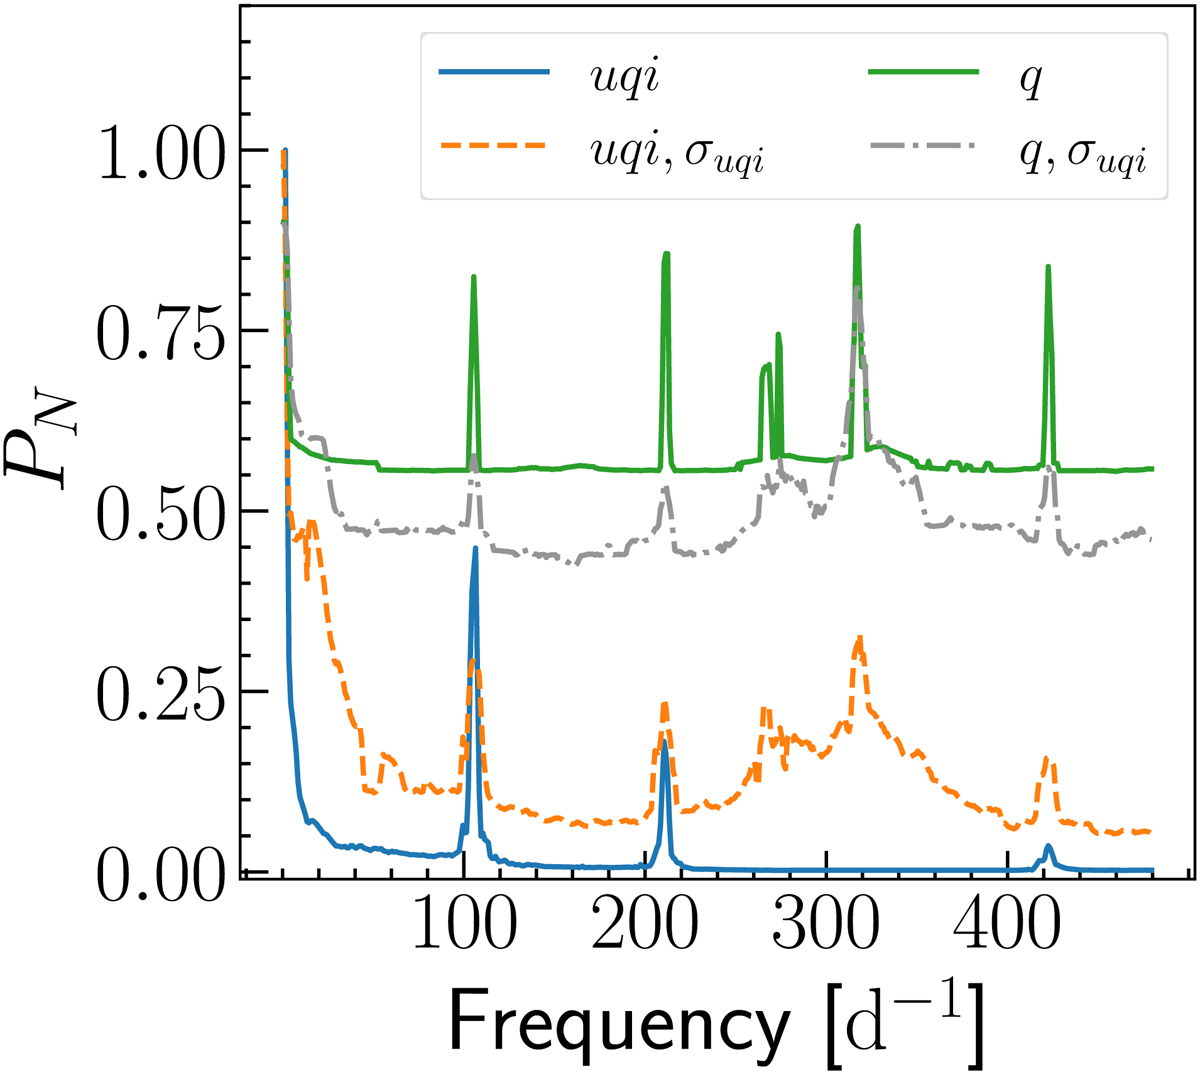
Averaged LS periodograms of the candidates’ window functions using a frequency bin width of 1 cycle per day. The solid blue and green lines correspond to the window functions in the composite uqi-band filters and the q band, respectively. The dashed orange and grey lines represent the same window functions, but with the contribution of the uncertainties of the magnitude values included in the calculation of the periodograms.
Current usage metrics show cumulative count of Article Views (full-text article views including HTML views, PDF and ePub downloads, according to the available data) and Abstracts Views on Vision4Press platform.
Data correspond to usage on the plateform after 2015. The current usage metrics is available 48-96 hours after online publication and is updated daily on week days.
Initial download of the metrics may take a while.