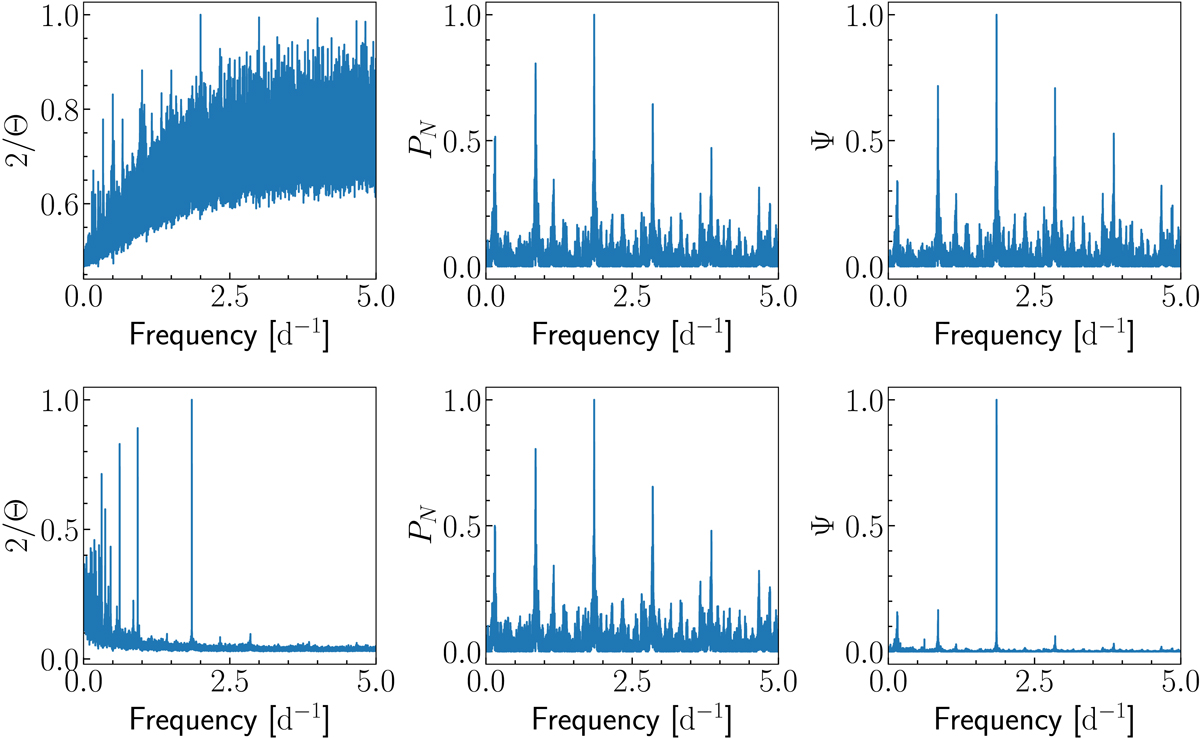
Fig. 8.
Download original image
Illustration of the difference between scaling the magnitudes to have the same amplitude before computing the periodogram (bottom panel) and without scaling the magnitudes (top panel). The improvement in the cleanliness of the periodogram using Ψ is shown in the right panels. These plots correspond to the second target in Table 2 or a zoomed-in version of the top middle panel in Fig. 12.
Current usage metrics show cumulative count of Article Views (full-text article views including HTML views, PDF and ePub downloads, according to the available data) and Abstracts Views on Vision4Press platform.
Data correspond to usage on the plateform after 2015. The current usage metrics is available 48-96 hours after online publication and is updated daily on week days.
Initial download of the metrics may take a while.