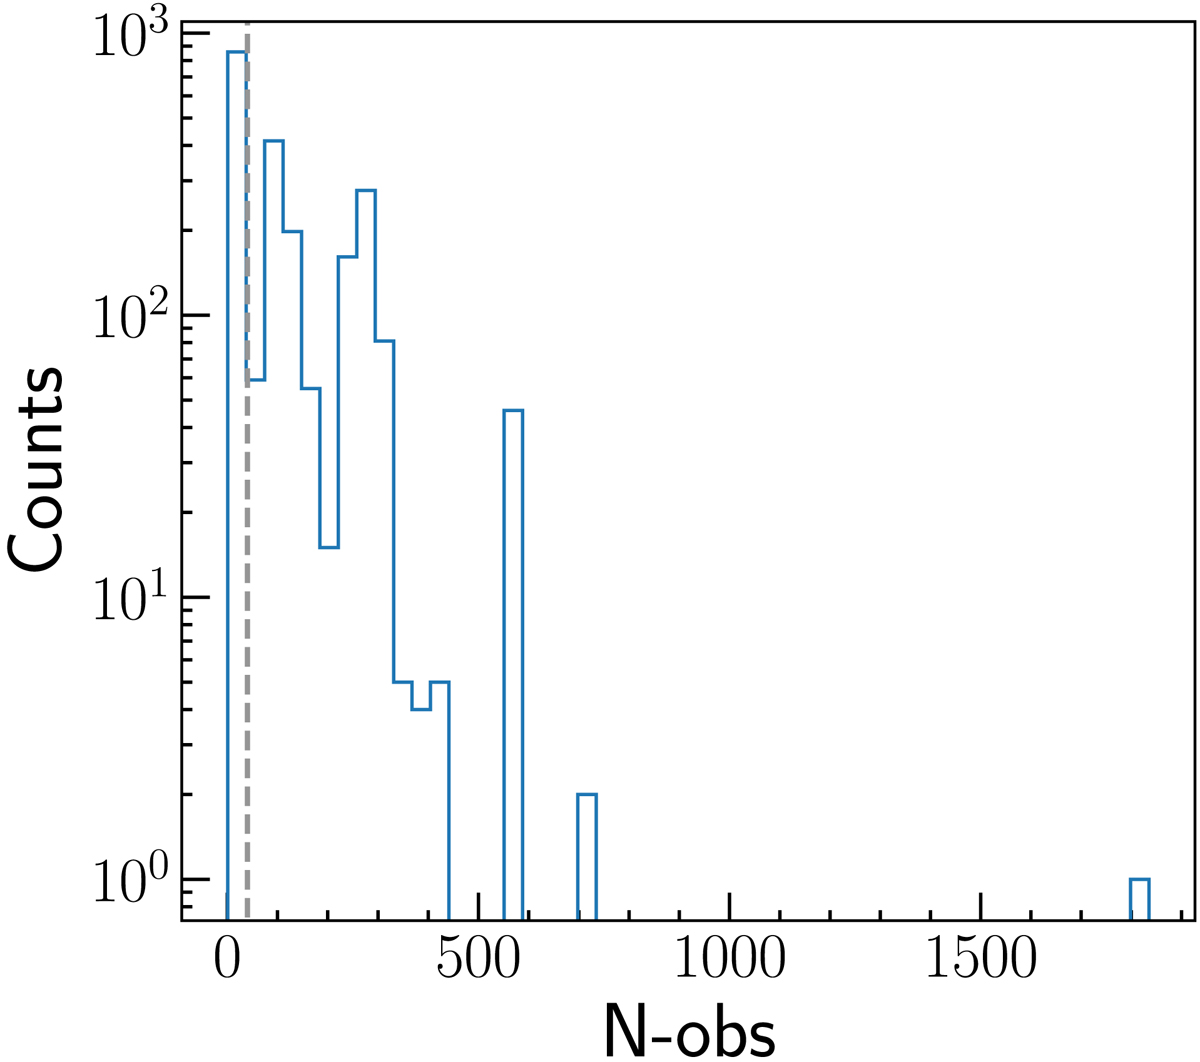
Fig. 5.
Download original image
Distribution of the number of observations in the q-band filter (N-obs) for the 2188 sdB candidates. The y-axis corresponds to the number of objects per N-obs bin and is represented on a logarithmic scale. The vertical dashed grey line indicates the cutoff at N-obs = 40 in MeerLICHT q-band observations. All objects to the right of this cutoff line are selected to be in our sdB candidate sample.
Current usage metrics show cumulative count of Article Views (full-text article views including HTML views, PDF and ePub downloads, according to the available data) and Abstracts Views on Vision4Press platform.
Data correspond to usage on the plateform after 2015. The current usage metrics is available 48-96 hours after online publication and is updated daily on week days.
Initial download of the metrics may take a while.