Open Access
Fig. 14.
Download original image
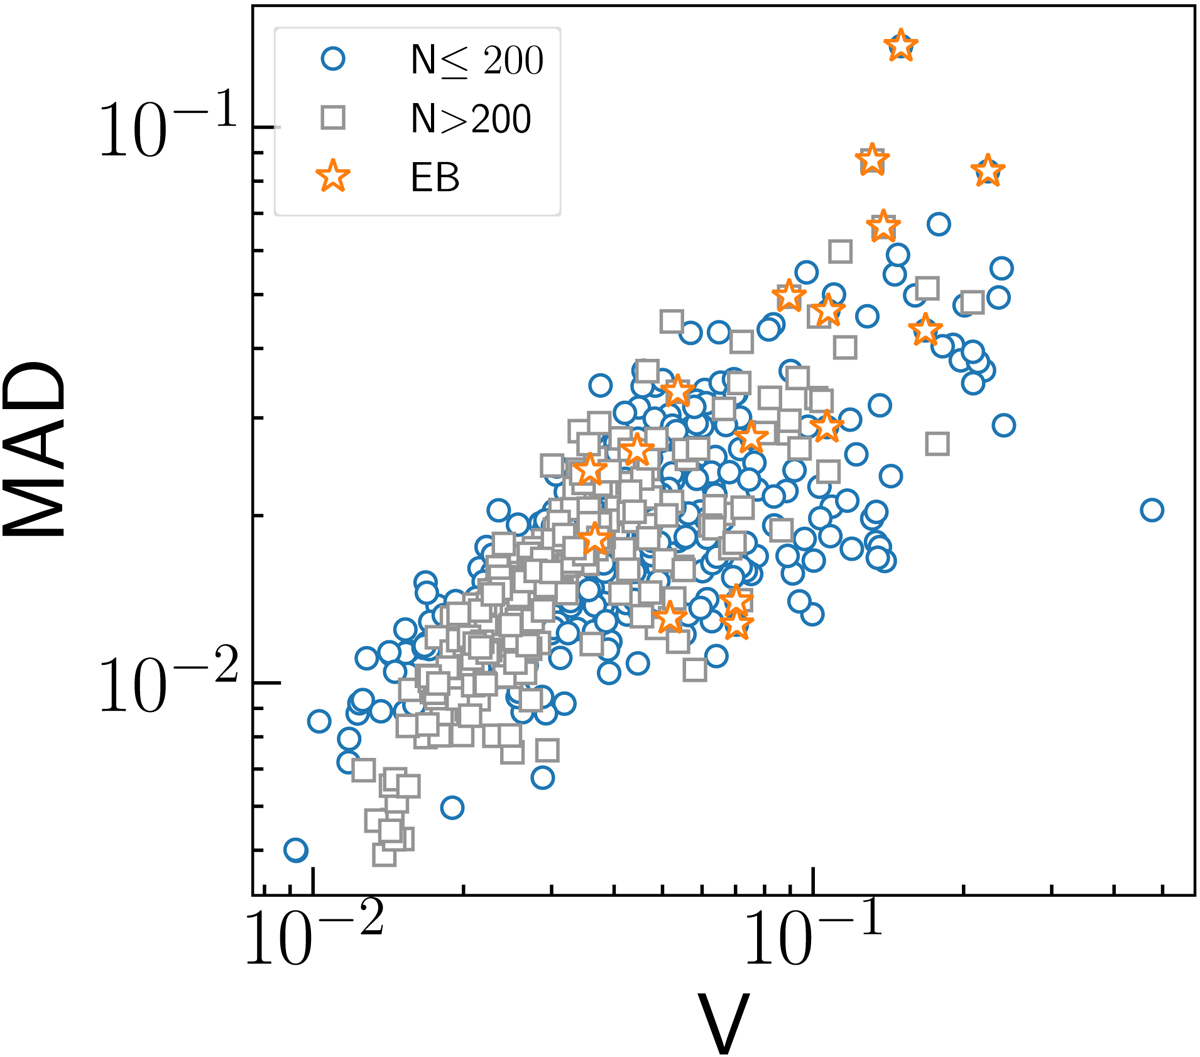
MAD vs. the magnitude of variability index (V). The open blue circles represent objects with a number of data points N < 200 in the q band; the grey squares represent those with N > 200. Candidates observed as EBs are represented in orange.
Current usage metrics show cumulative count of Article Views (full-text article views including HTML views, PDF and ePub downloads, according to the available data) and Abstracts Views on Vision4Press platform.
Data correspond to usage on the plateform after 2015. The current usage metrics is available 48-96 hours after online publication and is updated daily on week days.
Initial download of the metrics may take a while.