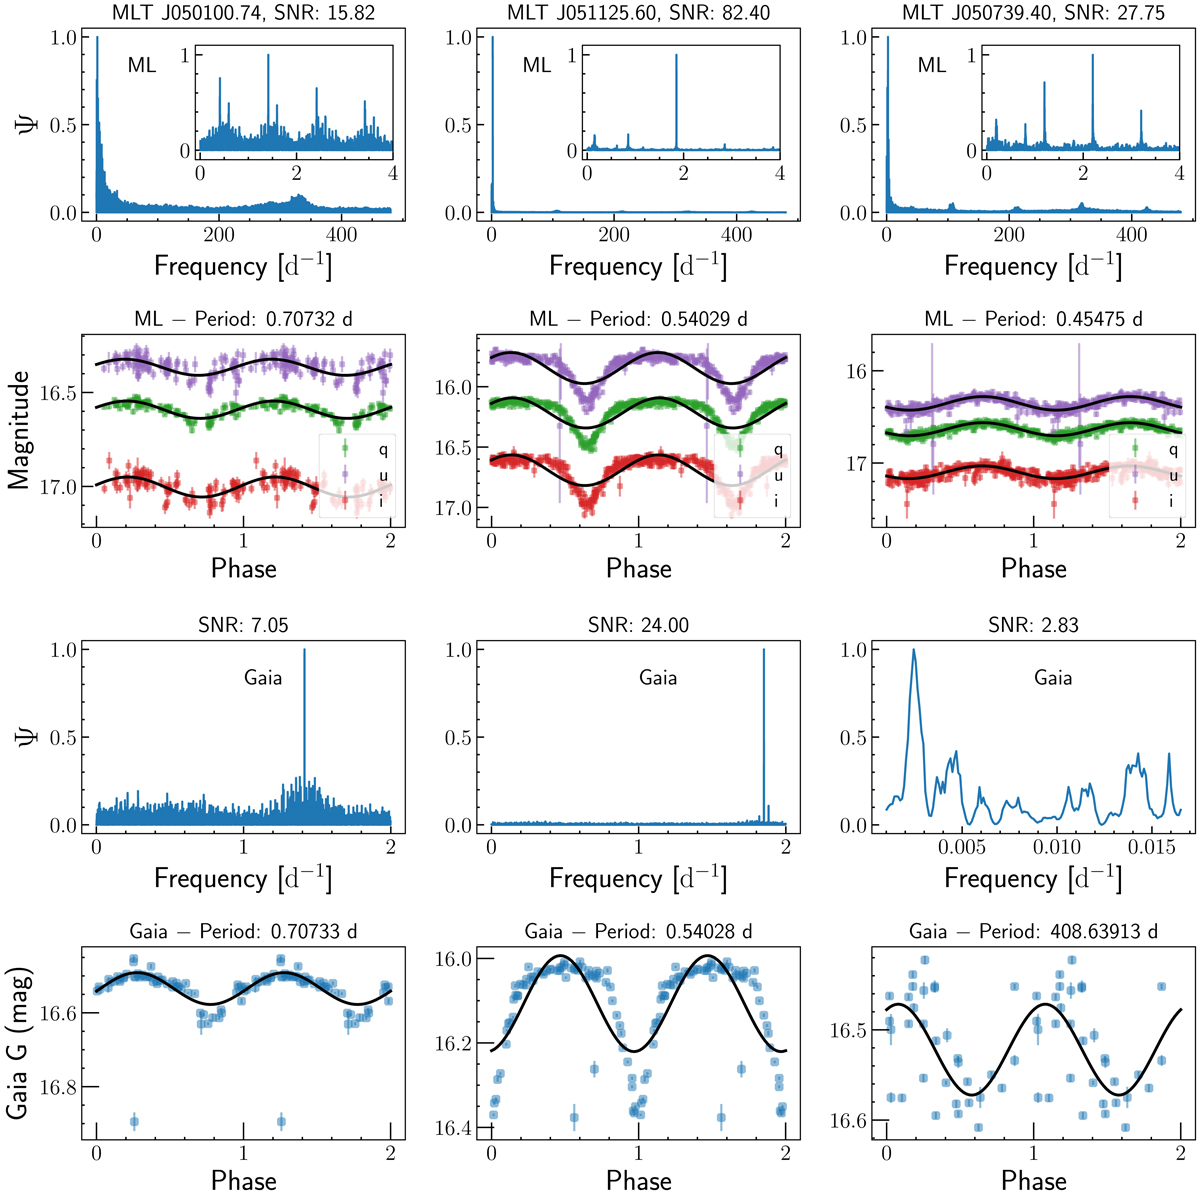
Fig. 12.
Download original image
Comparison of MeerLICHT and Gaia periodograms and phase-folded light curves for Nbase = 1. Each column represents one of the three sdB candidates. The first and second rows represent the periodograms and phase-folded light curves for MeerLICHT data, respectively, whereas the last two rows correspond to that of Gaia data. The black curve is the model fit to the data using the LS model. For illustration purposes, the phase is plotted twice.
Current usage metrics show cumulative count of Article Views (full-text article views including HTML views, PDF and ePub downloads, according to the available data) and Abstracts Views on Vision4Press platform.
Data correspond to usage on the plateform after 2015. The current usage metrics is available 48-96 hours after online publication and is updated daily on week days.
Initial download of the metrics may take a while.