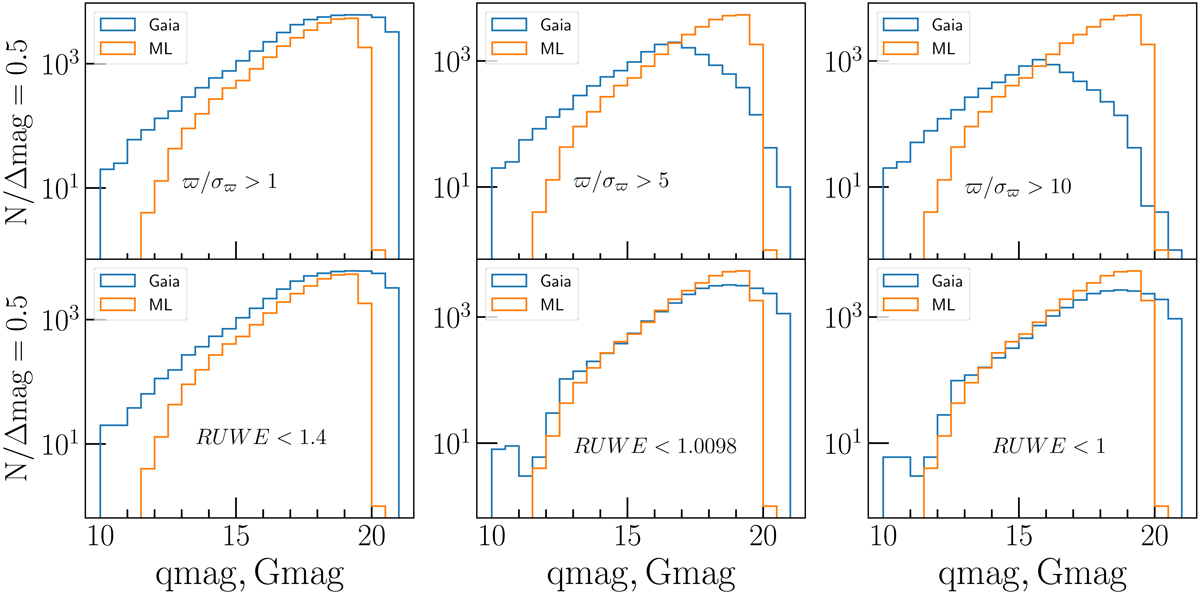
Fig. 1.
Download original image
Magnitude distribution of the MeerLICHT (ML) q band and the Gaia G band in a field with a galactic latitude above 20° (b = 21.08°), using a magnitude bin width of Δmag = 0.5 mag. The y-axis represents the number of data points per magnitude bin, and the x-axis corresponds to MeerLICHT’s q-band magnitude (qmag) and Gaia G-band magnitude (Gmag). The parallax over parallax error (ϖ/σϖ) and the RUWE cuts are applied independently to the Gaia data. The value in the middle bottom panel corresponds to the median of the RUWE.
Current usage metrics show cumulative count of Article Views (full-text article views including HTML views, PDF and ePub downloads, according to the available data) and Abstracts Views on Vision4Press platform.
Data correspond to usage on the plateform after 2015. The current usage metrics is available 48-96 hours after online publication and is updated daily on week days.
Initial download of the metrics may take a while.