Open Access
Fig. B.2.
Download original image
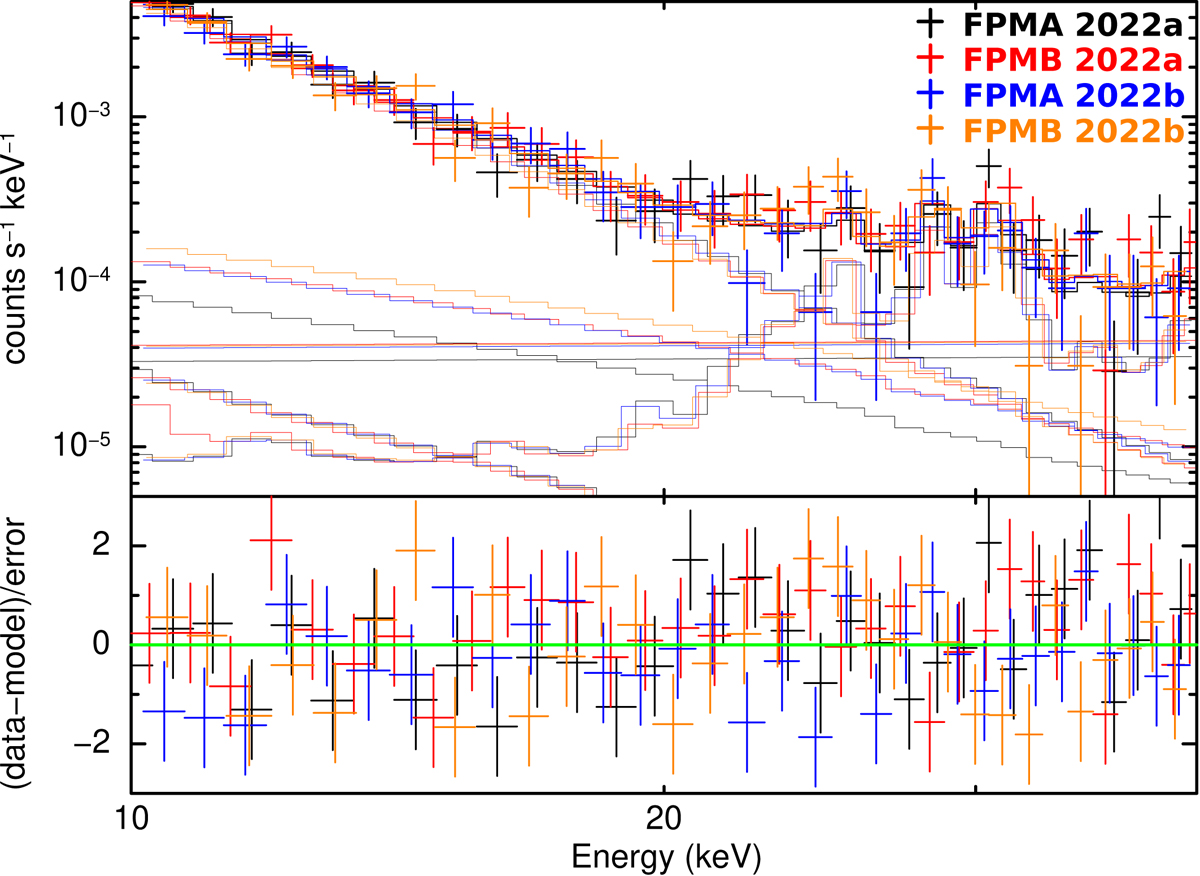
NuSTAR spectra from the region of Apep for the two observations and cameras. This is not background subtracted, but instead, a background model was fitted using nuskybgd; the multiple components of this background model are shown as thin lines. The source model is TBabs*vphabs*(vpshock+po).
Current usage metrics show cumulative count of Article Views (full-text article views including HTML views, PDF and ePub downloads, according to the available data) and Abstracts Views on Vision4Press platform.
Data correspond to usage on the plateform after 2015. The current usage metrics is available 48-96 hours after online publication and is updated daily on week days.
Initial download of the metrics may take a while.