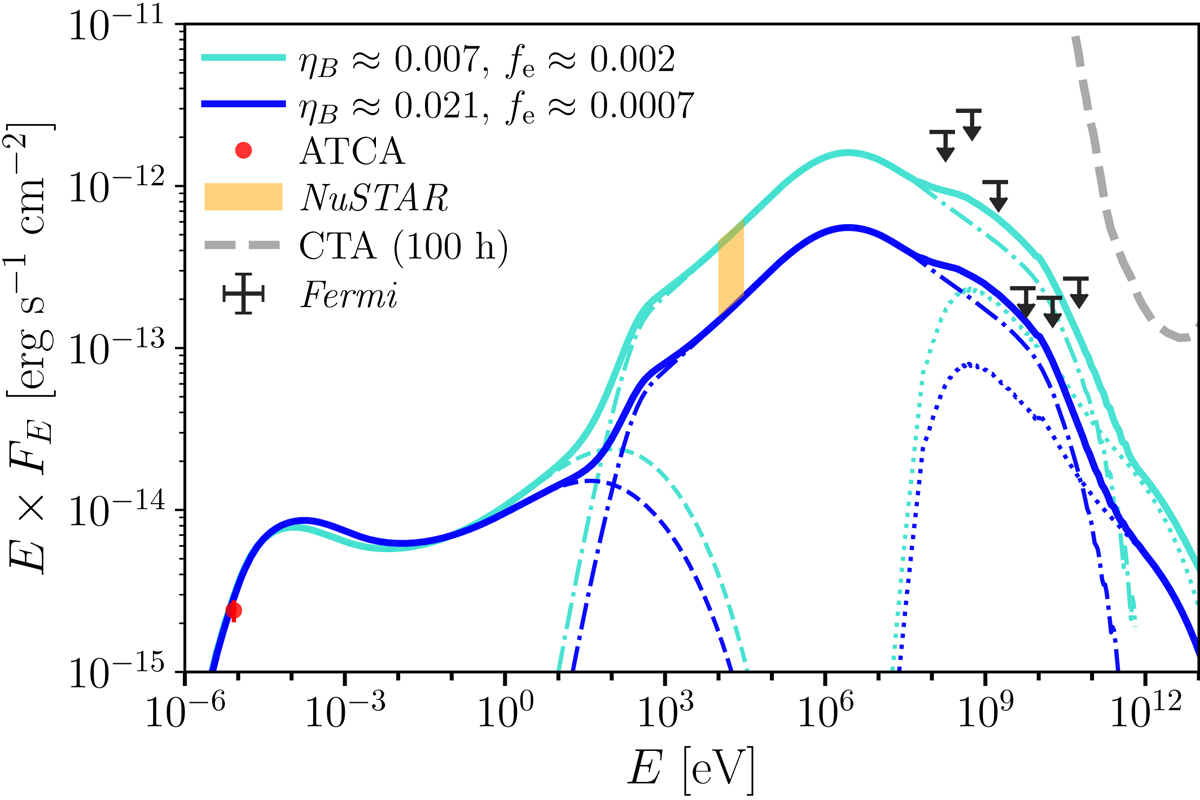
Fig. 6.
Download original image
Modelled broadband non-thermal SED of Apep. We show SEDs for the two extreme combinations of parameters that are compatible with the hard X-ray emission component detected with NuSTAR (this work) and with the ATCA radio data (Callingham et al. 2019). Dashed lines show the synchrotron component, dot-dashed lines show the IC component, dotted lines show the p-p component, and solid lines show the total SED. We also show the Fermi-LAT upper limits from Martí-Devesa et al. (2023) and the sensitivity curve for CTA (Funk et al. 2013).
Current usage metrics show cumulative count of Article Views (full-text article views including HTML views, PDF and ePub downloads, according to the available data) and Abstracts Views on Vision4Press platform.
Data correspond to usage on the plateform after 2015. The current usage metrics is available 48-96 hours after online publication and is updated daily on week days.
Initial download of the metrics may take a while.