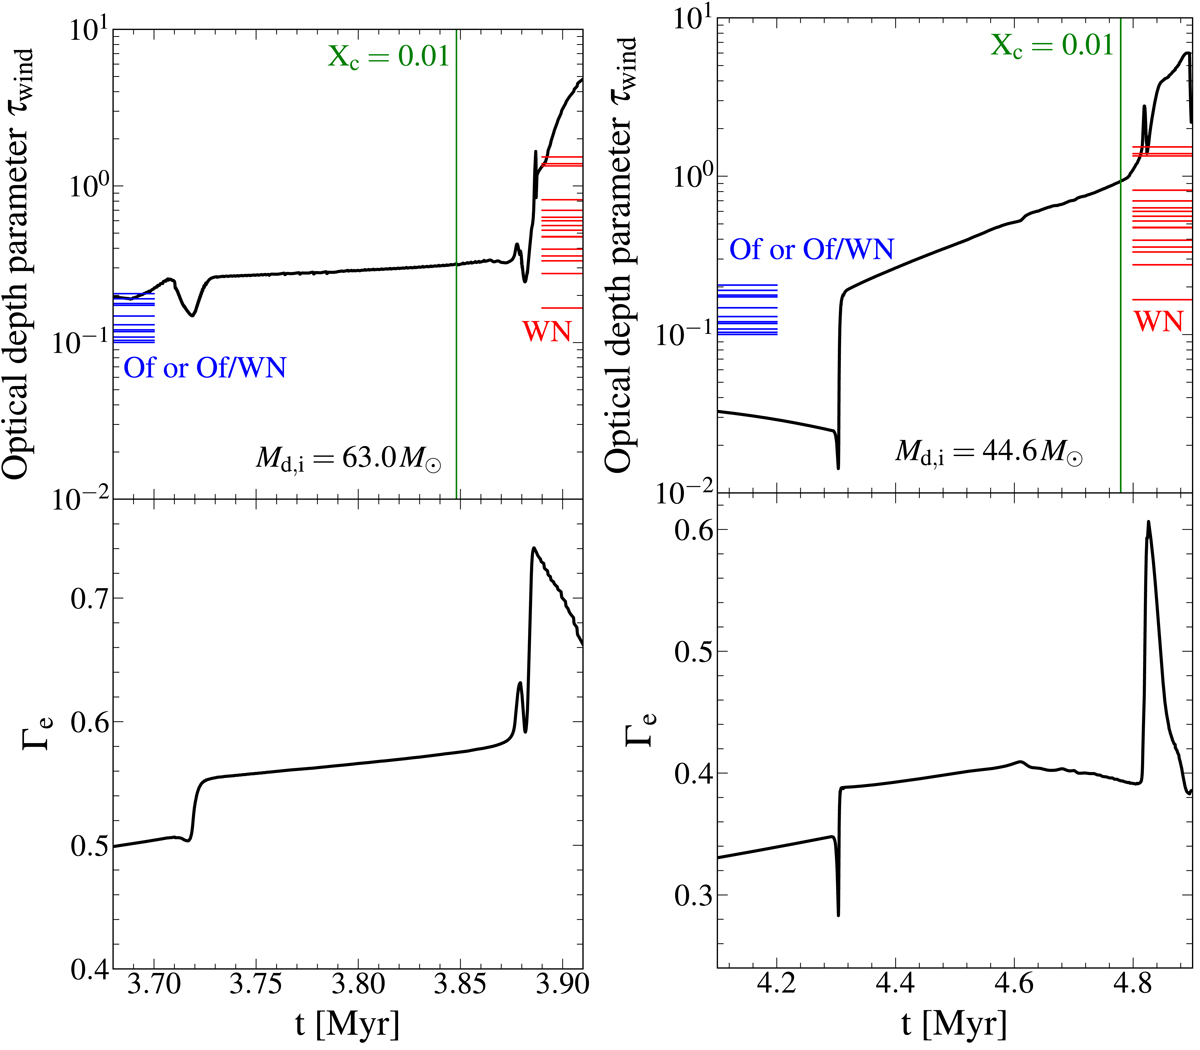
Fig. 4.
Download original image
Time evolution of optical depth parameter τwind (top panels) and electron scattering Eddington factor Γe (bottom panels, Eq. (2)) of the donor (black lines) for our two example models (Appendix A). The x-axis limits are the same as in Fig. A.1. The green vertical lines indicate the age at which the central hydrogen mass fraction of the donor is equal to 0.01, that is, the donor completes core hydrogen burning. The red and blue horizontal lines denote the calculated optical depth parameter of the observed LMC WN stars and Of or Of/WN stars, respectively, which have a surface hydrogen mass fraction of XH ≥ 0.4 (Table 1).
Current usage metrics show cumulative count of Article Views (full-text article views including HTML views, PDF and ePub downloads, according to the available data) and Abstracts Views on Vision4Press platform.
Data correspond to usage on the plateform after 2015. The current usage metrics is available 48-96 hours after online publication and is updated daily on week days.
Initial download of the metrics may take a while.