Open Access
Fig. 2
Download original image
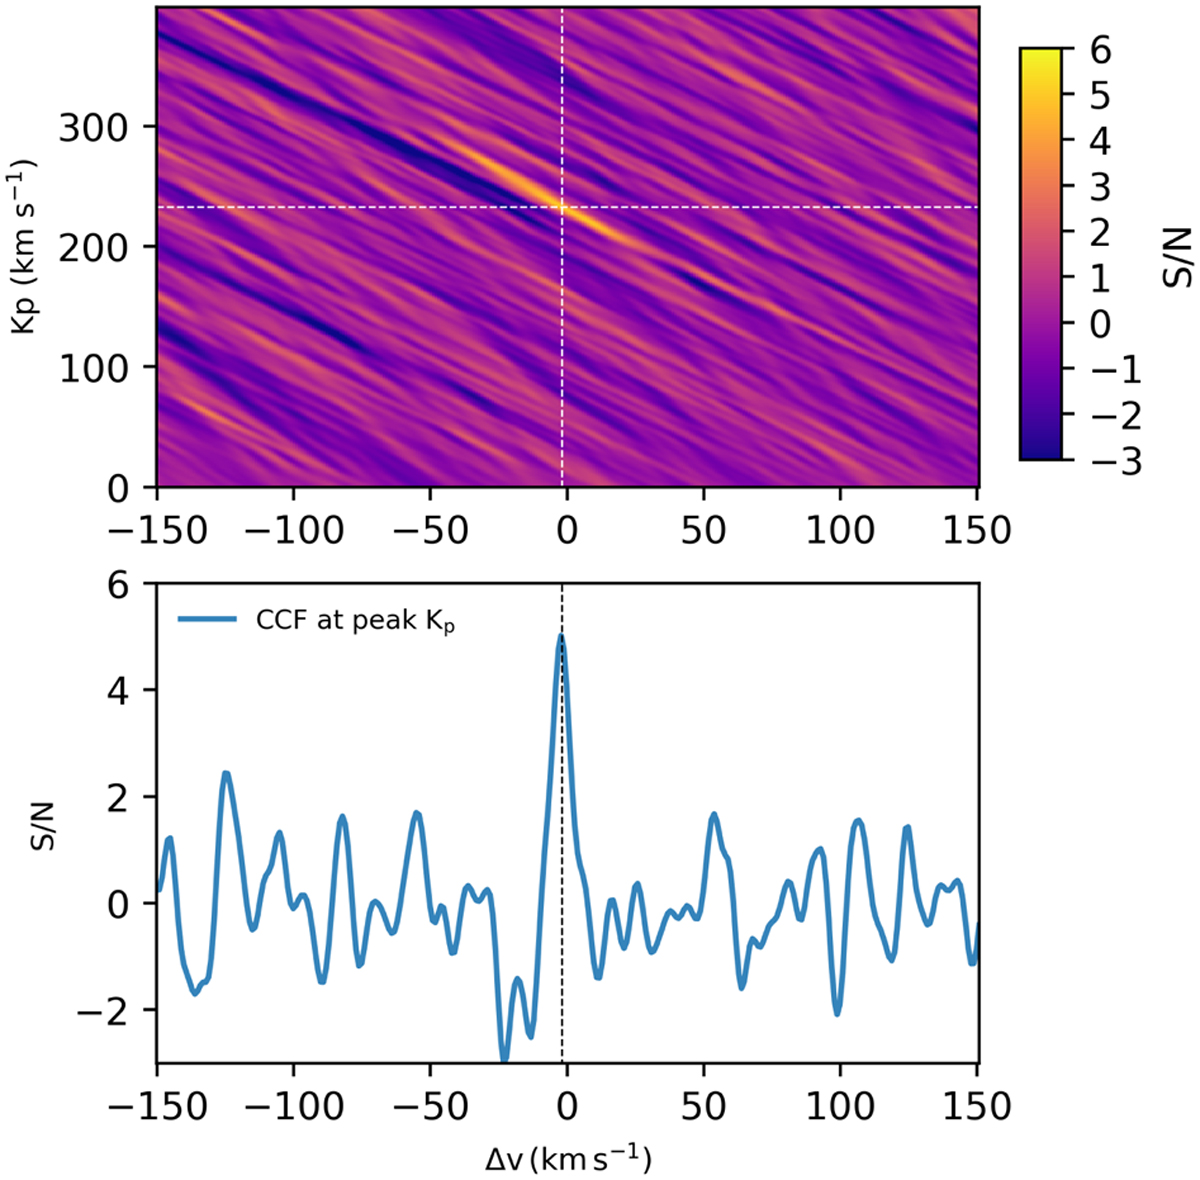
Kp map (upper panel) and the CCF at maximum S/N (lower panel) for the CO signal of WASP-18b. The crossing of the dashed white lines is the location of the maximum S/N.
Current usage metrics show cumulative count of Article Views (full-text article views including HTML views, PDF and ePub downloads, according to the available data) and Abstracts Views on Vision4Press platform.
Data correspond to usage on the plateform after 2015. The current usage metrics is available 48-96 hours after online publication and is updated daily on week days.
Initial download of the metrics may take a while.