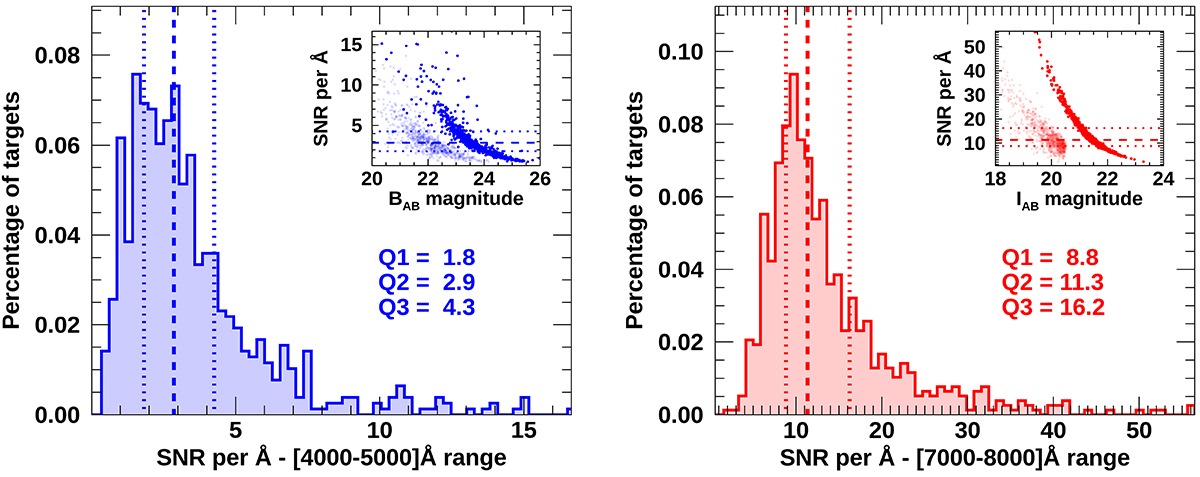
Fig. 9.
Download original image
Normalized distribution of the expected S/N Å−1 in the observed [4000−5000] and [7000−8000] Å wavelength ranges (left and right), assuming the stacking of 21 exposures of 20 min each (including overheads) for a total exposure time of 7 h. The estimate was obtained using the results of the latest operation rehearsal performed within the WEAVE project. Median and quartile values are shown by the vertical lines. The inset plots in each panel show the relation between the BAB/IAB magnitudes and observed S/N Å−1 in the defined wavelength range. For each observed galaxy, lighter points show total magnitudes and darker points show magnitudes within the fibre, see text for more details. See text for more details.
Current usage metrics show cumulative count of Article Views (full-text article views including HTML views, PDF and ePub downloads, according to the available data) and Abstracts Views on Vision4Press platform.
Data correspond to usage on the plateform after 2015. The current usage metrics is available 48-96 hours after online publication and is updated daily on week days.
Initial download of the metrics may take a while.