Fig. 5.
Download original image
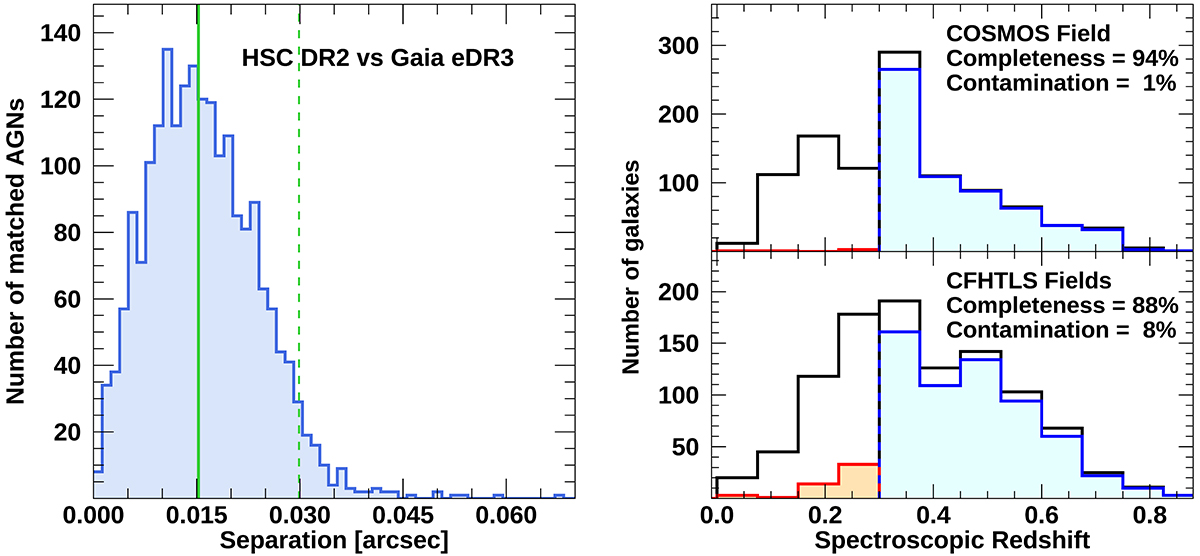
Astrometric and photometric redshift quality of HSC-SSP data in the four WEAVE-StePS fields. Left panel: histogram of the coordinate cross-match statistics obtained for ∼2000 matched AGNs, obtained by comparing their Gaia EDR3 and HSC-SSP DR2 coordinates (see text for more details). The median value is the green line at a separation of ![]() , and the dashed line is the 95% percentile limit, corresponding to a separation on the sky of
, and the dashed line is the 95% percentile limit, corresponding to a separation on the sky of ![]() . Right panel: completeness and purity of our target selection, estimated using zCOSMOS and VVDS-Wide/Deep spectroscopic data. The top panel shows the COSMOS field, and the bottom panel shows the CFHTLS-W1 and CFHTLS-W2 fields, covered by HSC deep and ultradeep and HSC wide data, respectively. The histogram outlined in black shows the spectroscopic redshift of all galaxies with a magnitude IAB < 20.5. The cyan histogram shows the distribution in spec-z of galaxies whose spectroscopic and photometric redshifts, computed using the DEmP algorithm (Hsieh & Yee 2014), are above the 0.3 value redshift cut-off. The orange histogram is the spectroscopic redshift distribution of the subset of galaxies whose photometric redshift is above 0.3 when the corresponding spectroscopic redshift is below this value, as shown by the x-axis. The corresponding values for completeness and contamination of the sample selected using DEmP photometric redshifts are 94/88% and 1/8%, respectively (see text for more details).
. Right panel: completeness and purity of our target selection, estimated using zCOSMOS and VVDS-Wide/Deep spectroscopic data. The top panel shows the COSMOS field, and the bottom panel shows the CFHTLS-W1 and CFHTLS-W2 fields, covered by HSC deep and ultradeep and HSC wide data, respectively. The histogram outlined in black shows the spectroscopic redshift of all galaxies with a magnitude IAB < 20.5. The cyan histogram shows the distribution in spec-z of galaxies whose spectroscopic and photometric redshifts, computed using the DEmP algorithm (Hsieh & Yee 2014), are above the 0.3 value redshift cut-off. The orange histogram is the spectroscopic redshift distribution of the subset of galaxies whose photometric redshift is above 0.3 when the corresponding spectroscopic redshift is below this value, as shown by the x-axis. The corresponding values for completeness and contamination of the sample selected using DEmP photometric redshifts are 94/88% and 1/8%, respectively (see text for more details).
Current usage metrics show cumulative count of Article Views (full-text article views including HTML views, PDF and ePub downloads, according to the available data) and Abstracts Views on Vision4Press platform.
Data correspond to usage on the plateform after 2015. The current usage metrics is available 48-96 hours after online publication and is updated daily on week days.
Initial download of the metrics may take a while.