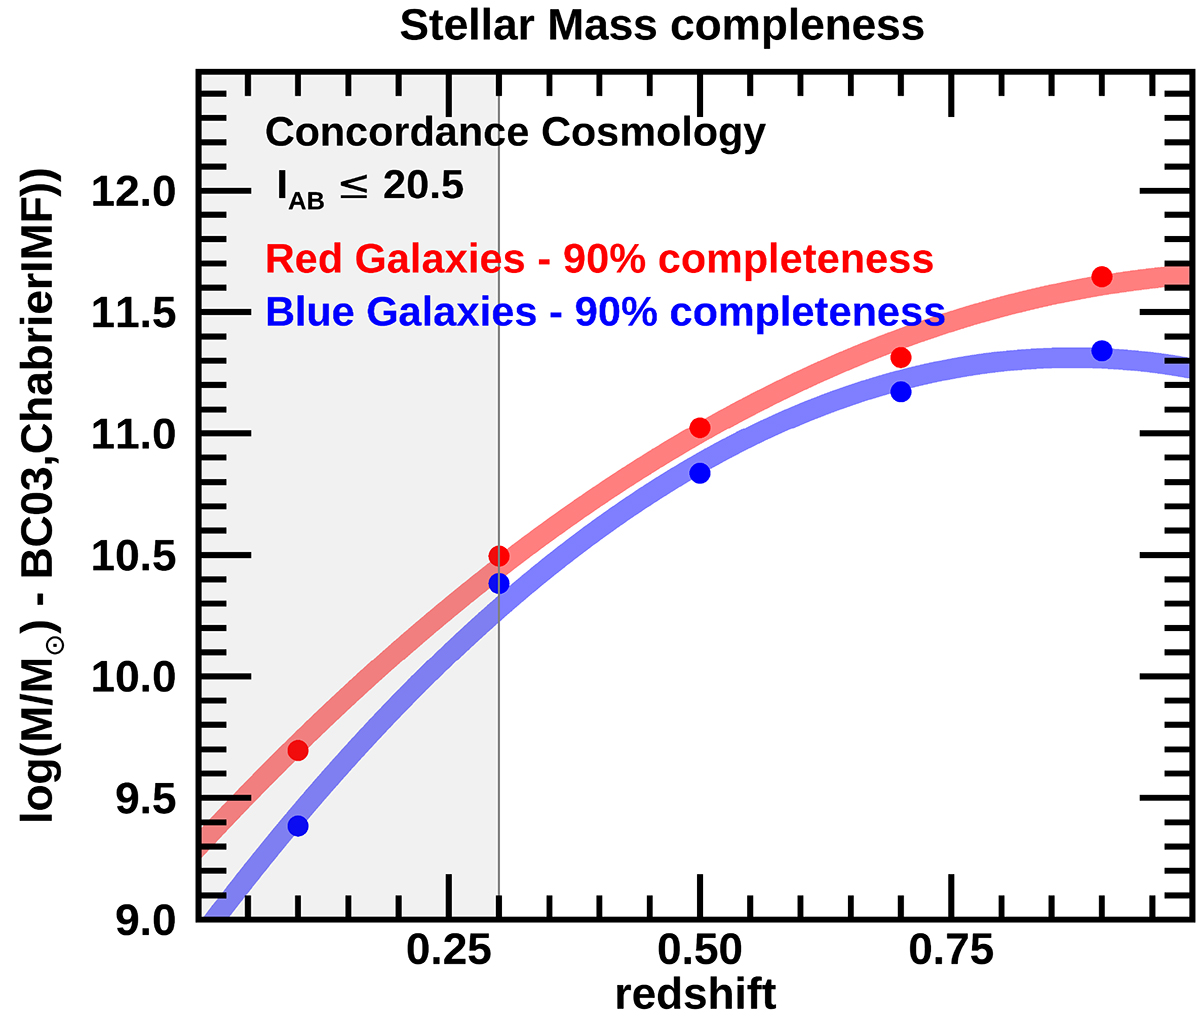
Fig. 4.
Download original image
90% colour-dependent completeness limit in stellar mass for blue and red galaxies as a function of redshift (blue and red lines). We used data and stellar masses (Chabrier IMF) from the UltraVISTA catalogue in the COSMOS field (McCracken et al. 2012; Ilbert et al. 2013), and the blue and red galaxies were defined using a simple colour-colour rest-frame NUV − R − J plot. The shaded area indicates the z ≤ 0.3 redshift range.
Current usage metrics show cumulative count of Article Views (full-text article views including HTML views, PDF and ePub downloads, according to the available data) and Abstracts Views on Vision4Press platform.
Data correspond to usage on the plateform after 2015. The current usage metrics is available 48-96 hours after online publication and is updated daily on week days.
Initial download of the metrics may take a while.