Fig. 3.
Download original image
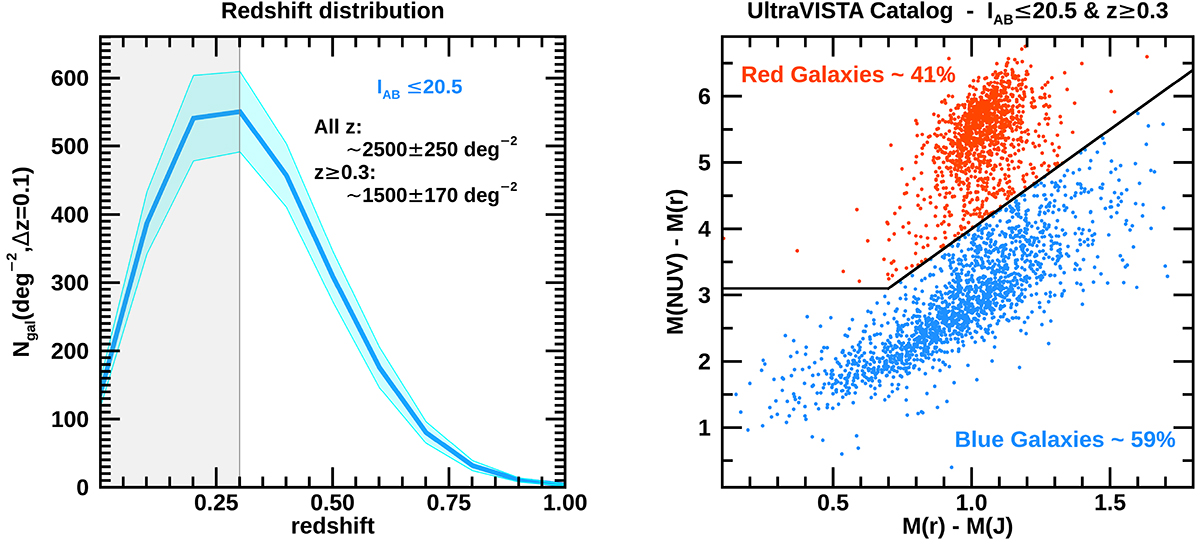
Expected redshift and colors distribution of WEAVE-StePS galaxies. Left panel: redshift distribution of a magnitude-limited sample of galaxies down to IAB ∼ 20.5. The y-axis shows the expected surface density of galaxies per square degree and per 0.1 redshift interval. The mean values (thick line) and their field-to-field variance (shaded region) were obtained in random positions within the CFHTLS-W1 and CFHTLS-W4 photometric catalogues (Ilbert et al. 2006; Hudelot et al. 2012). These numbers were obtained by removing all regions masked because of lower-quality photometry. Right panel: expected two-colour distribution of our target sample on the rest-frame colour-colour (NUV − r) and (r − J) plane, as obtained using the WEAVE-StePS sample definition and the UltraVISTA catalogue in the COSMOS field (McCracken et al. 2012; Ilbert et al. 2013). This colour-colour plot is an efficient way to distinguish between quiescent and star-forming galaxies, avoiding a mix between dusty star-forming galaxies and quiescent galaxies, as extinction moves star-forming galaxies along a diagonal direction parallel to the slanted line in the plot (see Ilbert et al. 2010, for more details).
Current usage metrics show cumulative count of Article Views (full-text article views including HTML views, PDF and ePub downloads, according to the available data) and Abstracts Views on Vision4Press platform.
Data correspond to usage on the plateform after 2015. The current usage metrics is available 48-96 hours after online publication and is updated daily on week days.
Initial download of the metrics may take a while.