Fig. 2.
Download original image
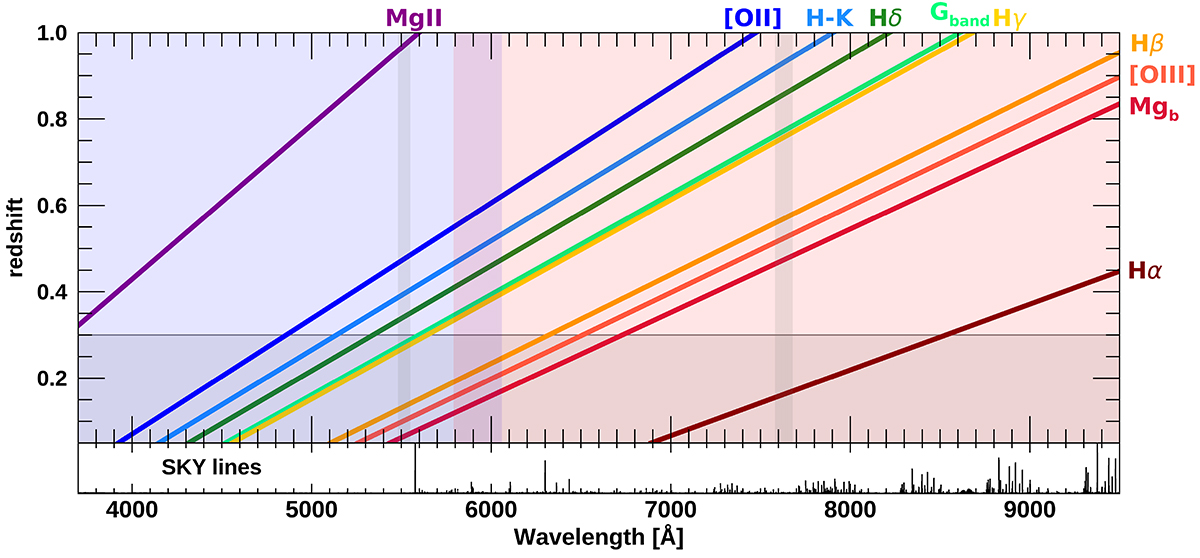
Observability of the main spectral indices as a function of redshift (0.05 < z < 1.0) in the wavelength range covered by the WEAVE spectrograph in its low-resolution mode. The visibility of other emission/absorption lines is easily extrapolated from adjacent indices. The blue (red) region indicates the wavelength range covered by the blue (red) arm of the WEAVE spectrograph, and the overlap region covered by both arms is shaded in violet. The two narrower vertical grey bands are CCD gaps in the blue and red arm of the WEAVE spectrograph. They indicate the redshift ranges in which some of the features will not be available in observations. The empty region shows the redshift range in which the large majority of StePS targets will be observed (z ≥ 0.3). The bottom panel shows an OH sky lines spectrum for reference.
Current usage metrics show cumulative count of Article Views (full-text article views including HTML views, PDF and ePub downloads, according to the available data) and Abstracts Views on Vision4Press platform.
Data correspond to usage on the plateform after 2015. The current usage metrics is available 48-96 hours after online publication and is updated daily on week days.
Initial download of the metrics may take a while.