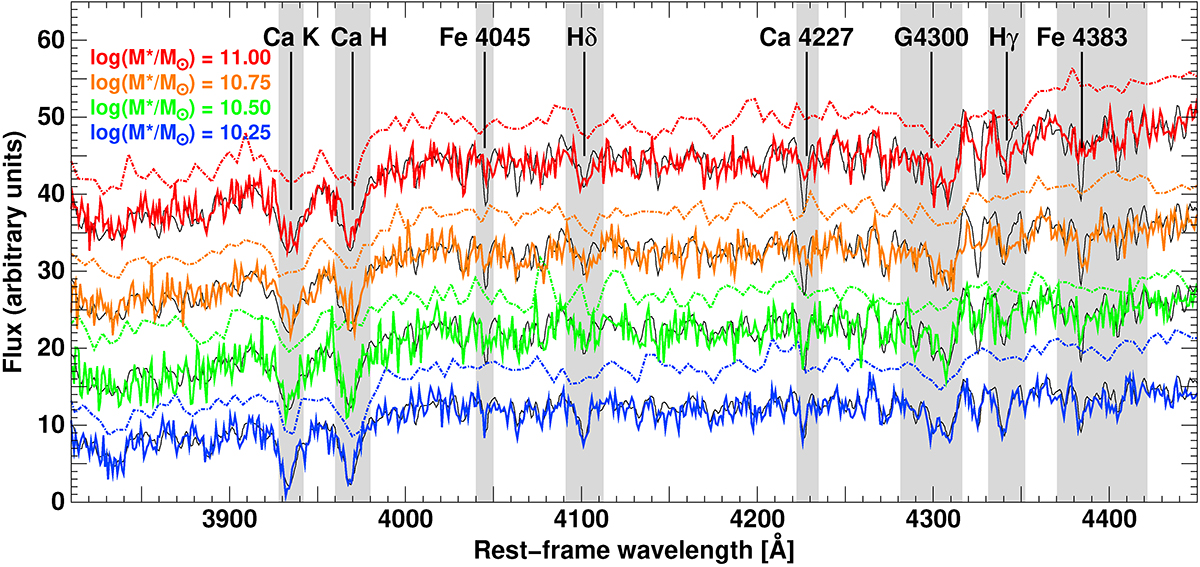
Fig. 1.
Download original image
Comparison of typical SDSS (z ∼ 0.1, solid coloured lines) and VIPERS (z ∼ 0.5, dash-dotted lines) spectra of four early-type galaxies of different stellar masses as indicated in the plot. VIPERS spectra are offset vertically by 10 units for clarity. The S/N values of all these spectra are close to the median value for galaxies of that mass in the corresponding survey. The black curves show model spectra of a single stellar population with solar metallicities and ages in the range of 2.5−10 Gyr (from bottom to top), obtained using the MILES spectral library (Vazdekis et al. 2010) and chosen to reproduce the data. Key spectral indices used for estimating the stellar ages or metallicities are indicated with their names, and the grey bands refer to the width of the Lick wavebands. The low S/N and low resolution (∼16 Å FWHM, R ∼ 210) of the VIPERS spectra smooth out (or fill in) the key spectral absorption features, preventing reliable measurements of the Lick indices for individual galaxies. The higher-resolution SDSS spectra retain the details of these absorption features.
Current usage metrics show cumulative count of Article Views (full-text article views including HTML views, PDF and ePub downloads, according to the available data) and Abstracts Views on Vision4Press platform.
Data correspond to usage on the plateform after 2015. The current usage metrics is available 48-96 hours after online publication and is updated daily on week days.
Initial download of the metrics may take a while.