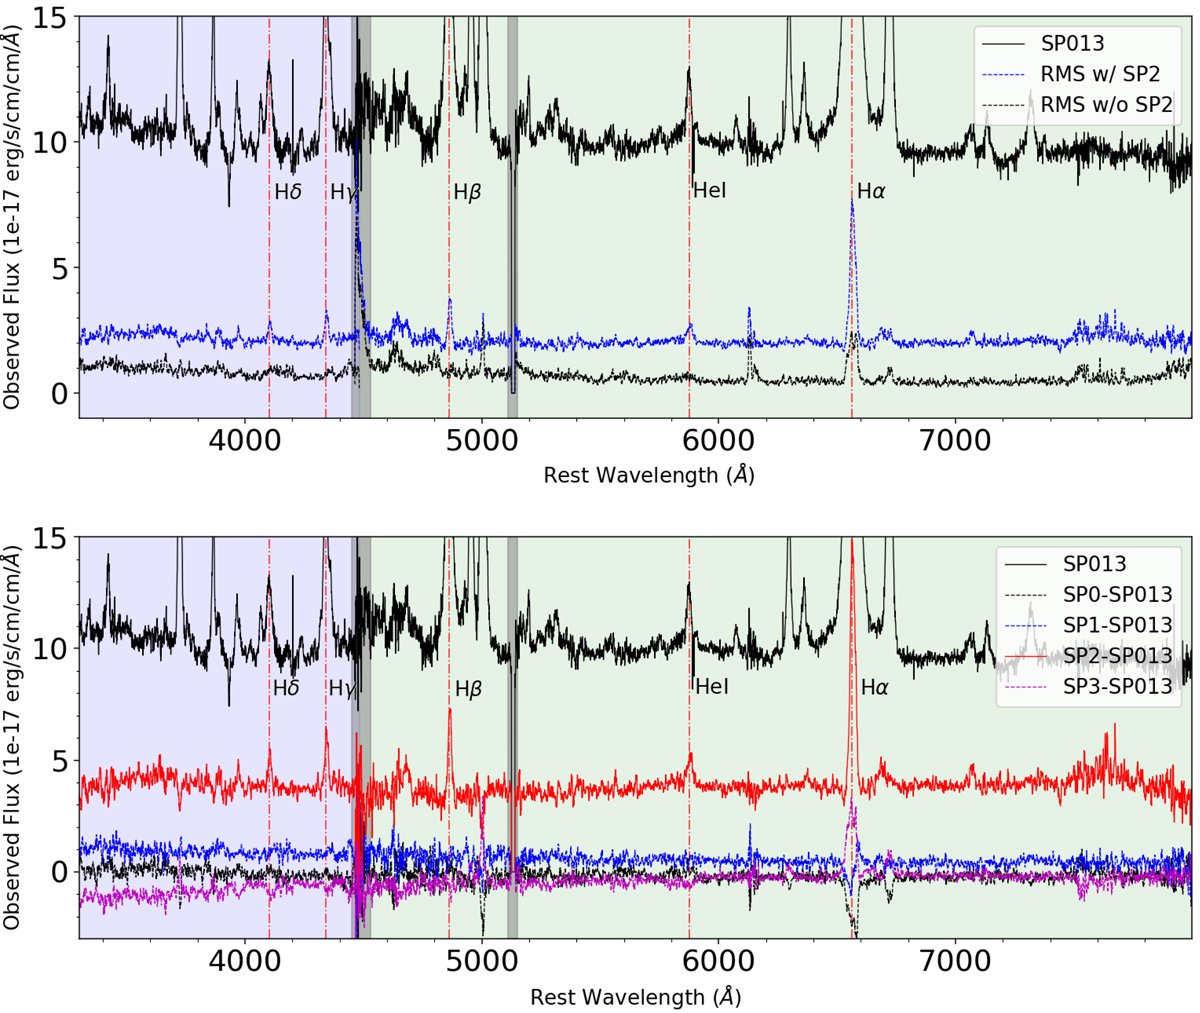
Fig. 2.

Download original image
Broad line enhancements in SP2, the post-flare spectrum. All plotted lines are indicated by the respective legends, while vertical dash-dotted line indicates the key Balmer and He Iλ5875 emission line. Blue region represents the UVB arm of X-shooter while the green region is VIS. Grey regions represents sections of the X-shooter spectra with bad pixels. SP013 in both panels are smoothed with a median filter with a 11 pixel window, while the other lines are smoothed with a 31 pixel window.
Current usage metrics show cumulative count of Article Views (full-text article views including HTML views, PDF and ePub downloads, according to the available data) and Abstracts Views on Vision4Press platform.
Data correspond to usage on the plateform after 2015. The current usage metrics is available 48-96 hours after online publication and is updated daily on week days.
Initial download of the metrics may take a while.


