Fig. 7.
Download original image
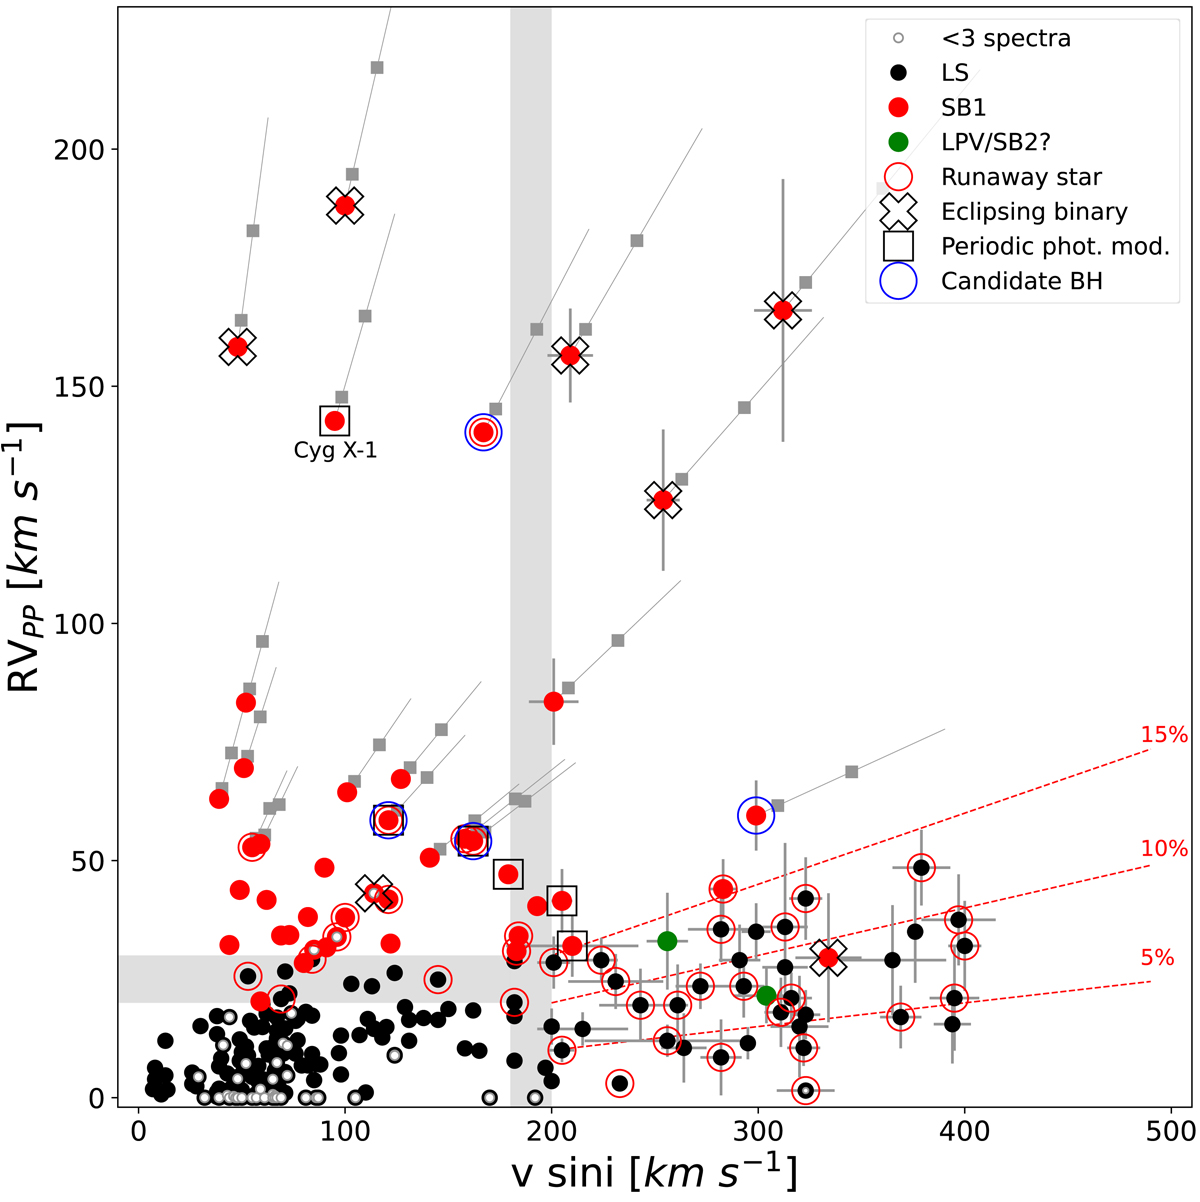
Distribution in the RVPP vs. v sin i diagram of the sample of 226 LS and SB1 O-type stars described in Sect. 4.1. The vertical gray area represents the artificial threshold between slow- and fast-rotating stars (180–200 km s−1). The horizontal gray area represents the RVPP threshold (20–30 km s−1) in the slow-rotating domain below which the identification of SB1 systems is more difficult due to the effect of intrinsic variability. We note that the small sample of 22 stars for which we only have one spectrum available (i.e. RVPP = 0) is also included for completeness. See Sect. 4.2 for the meaning of the inclined red and gray lines and other details. We also note that while we do not include results in this figure for the additional sample of 93 SB2 systems fulfilling the criteria indicated in Sect. 4.1, the corresponding number and percentage of stars of this type in both the fast- and slow-rotating domain can be found in Table 2.
Current usage metrics show cumulative count of Article Views (full-text article views including HTML views, PDF and ePub downloads, according to the available data) and Abstracts Views on Vision4Press platform.
Data correspond to usage on the plateform after 2015. The current usage metrics is available 48-96 hours after online publication and is updated daily on week days.
Initial download of the metrics may take a while.