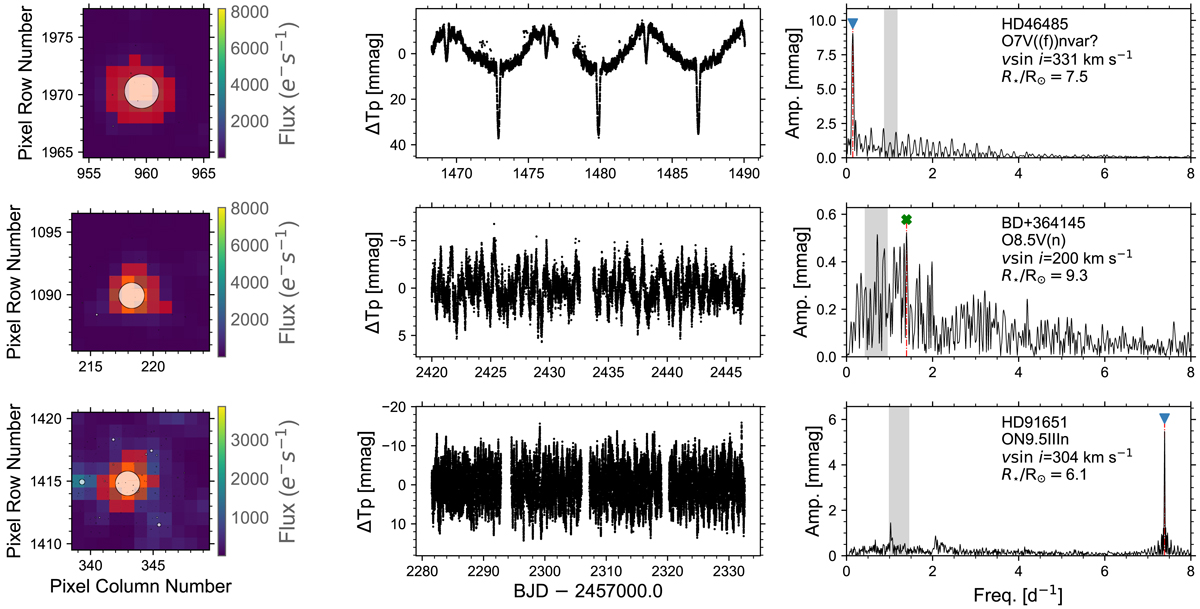
Fig. 6.
Download original image
Three examples of the typical TESS pixel maps, light curves, and periodograms for fast-rotating O-stars. In the left panels, we show the TESS pixel masks, with the pipeline mask in red and Gaia sources marked by white circles. The markers are scaled logarithmically with the Gaia magnitude of the source. In the middle panels, we show the one (or two) sector(s) TESS light curves extracted from the TESS pixel maps. In the right panels, we show the periodograms of the light curves. Significant frequencies, satisfying a signal to noise of 5 in a 1 d−1 window, are given by blue triangles. In the case of BD+36°4145 the highest amplitude frequency was not significant, and we therefore mark it by a green cross. The rotational modulation frequency range is given in gray. This range is estimated using the measured v sin i, an upper limit of veq = 450 km s−1 to account for the inclination and the stellar radius inferred from Gaia-EDR3 (cf. Table C.2).
Current usage metrics show cumulative count of Article Views (full-text article views including HTML views, PDF and ePub downloads, according to the available data) and Abstracts Views on Vision4Press platform.
Data correspond to usage on the plateform after 2015. The current usage metrics is available 48-96 hours after online publication and is updated daily on week days.
Initial download of the metrics may take a while.