Fig. 11.
Download original image
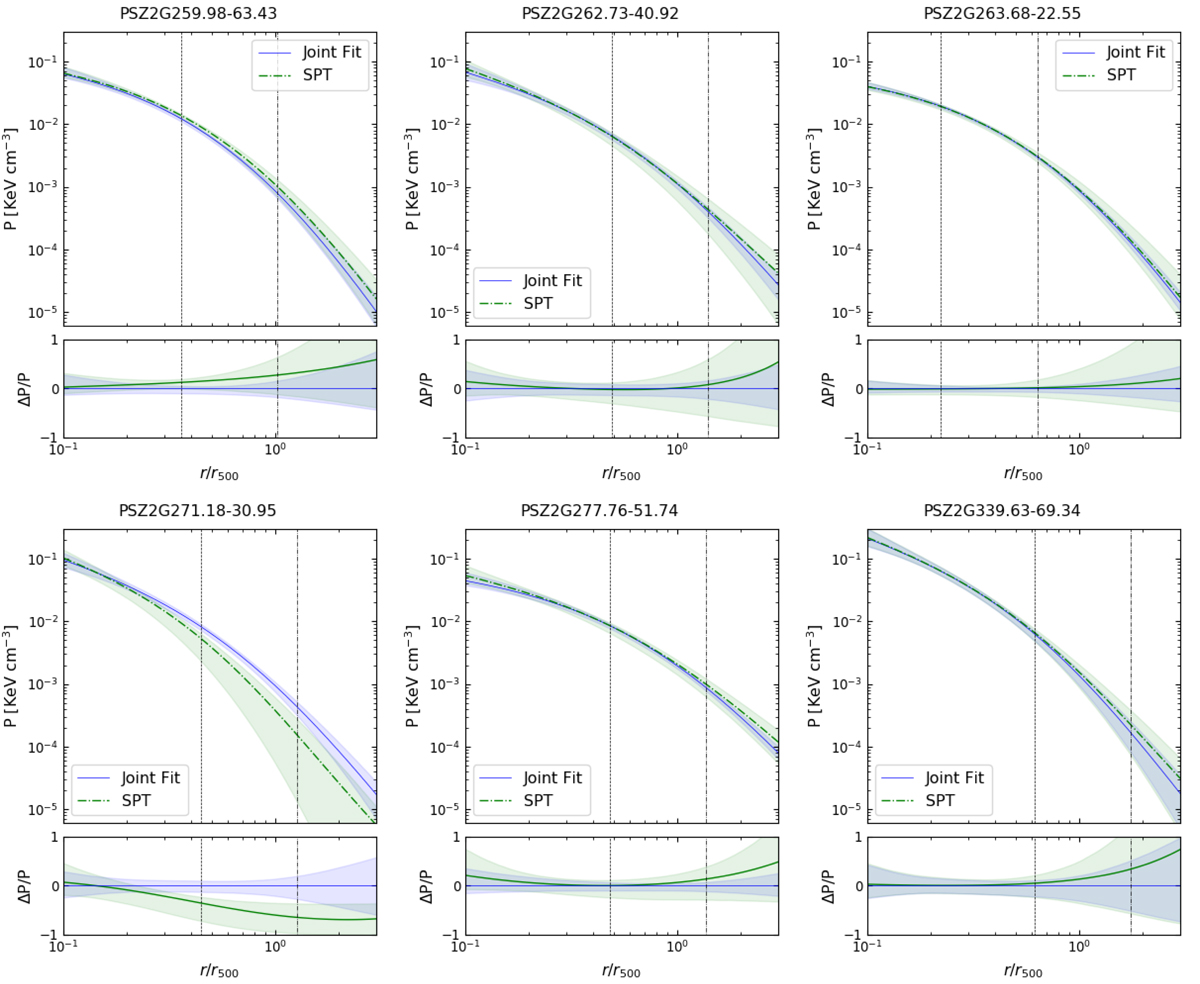
Comparison between pressure profiles from SPT data (dash dotted green lines) and from the joint fit on the two data sets (blue line). The vertical dashed lines indicate the FWHM of the SPT beam and the dash-dotted line the lower Planck beam FWHM (5 arcmin). The lower panels represent the relative deviation with respect to the joint fit.
Current usage metrics show cumulative count of Article Views (full-text article views including HTML views, PDF and ePub downloads, according to the available data) and Abstracts Views on Vision4Press platform.
Data correspond to usage on the plateform after 2015. The current usage metrics is available 48-96 hours after online publication and is updated daily on week days.
Initial download of the metrics may take a while.