Fig. 5.
Download original image
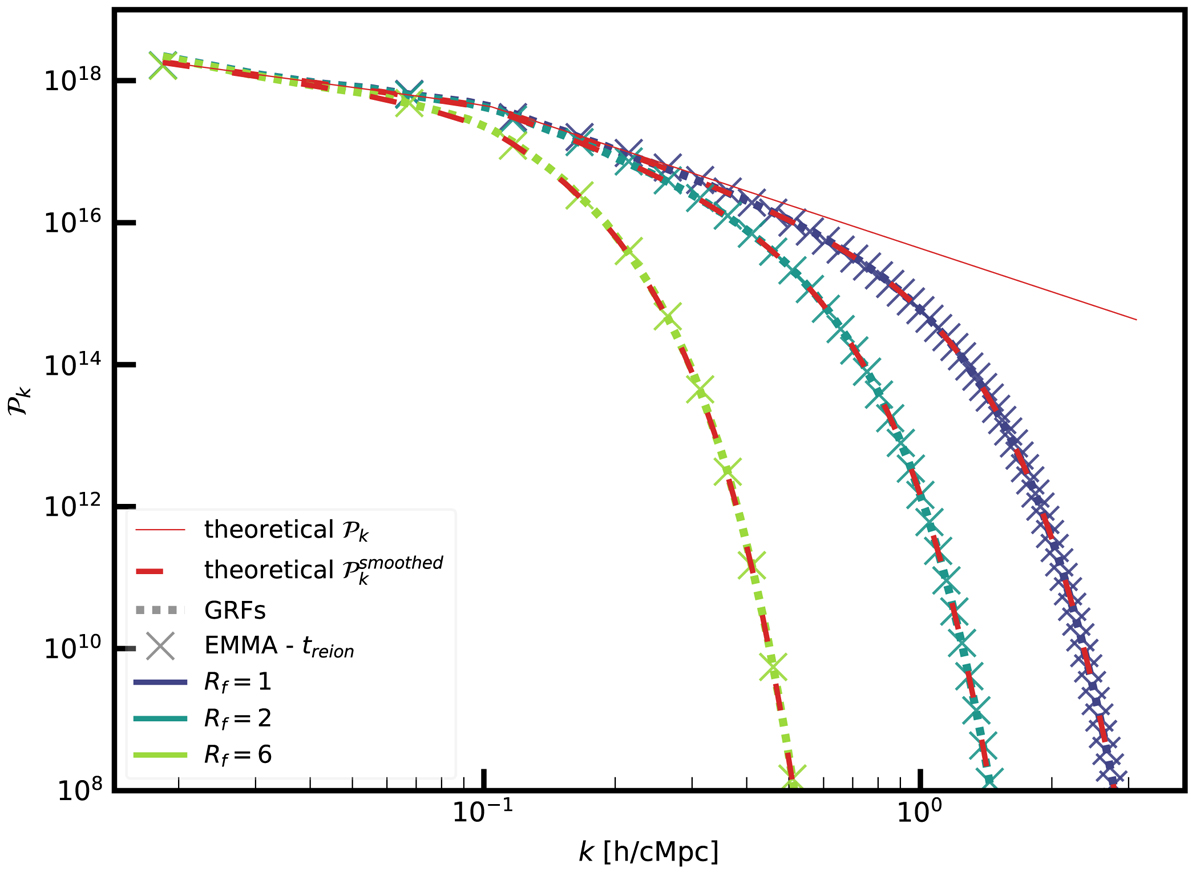
Power spectra of the GRFs (coloured dotted lines) and EMMA reionisation times (coloured crosses). All 100 runs have been averaged to show a mean power spectrum for each set of simulations. The theoretical power spectra are shown both with and without an incorporated smoothing by the dashed and straight red lines, respectively. Three different smoothings are represented with Rf ∈ {1, 2, 6}.
Current usage metrics show cumulative count of Article Views (full-text article views including HTML views, PDF and ePub downloads, according to the available data) and Abstracts Views on Vision4Press platform.
Data correspond to usage on the plateform after 2015. The current usage metrics is available 48-96 hours after online publication and is updated daily on week days.
Initial download of the metrics may take a while.